All published articles of this journal are available on ScienceDirect.

Toward Sustainable Clay-based Additive Manufacturing: Fresh-State and Hardened Mechanical Characterization of 3D-Printable Benjellik Clay Paste
 iD
Iatimad Akhrif1
iD
Mostapha El Jai1 , 2
iD
Fatima Zahra Oulkhir1
iD
iD
Iatimad Akhrif1
iD
Mostapha El Jai1 , 2
iD
Fatima Zahra Oulkhir1
iD
Authors Info & Affiliations
Abstract
Introduction/Objective
Additive manufacturing (AM), particularly 3D printing, has revolutionized material processing by enabling complex geometries with high precision and minimal waste. While Fez-Moroccan clays (specifically from the Benjellik quarry) have been thoroughly characterized for their mineralogical and physicochemical properties, their mechanical behavior - essential for assessing buildability and structural integrity in printed structures - remains poorly understood. This study aims to address this limitation by evaluating the mechanical performance of a 3D-printable clay paste.
Methods
A comprehensive experimental framework was implemented to assess key mechanical properties of the clay paste. Measurements included Young’s modulus, yield stress, and strain evolution; analysis of drying-induced shrinkage behavior; assessment of fracture modes; and evaluation of how different infill patterns influence compressive strength.
Results
The clay paste, formulated at a water-to-binder ratio of 37.5%, exhibited drying-time-dependent mechanical behavior over a 21-day period. Young's modulus and compressive strength increased asymptotically to 130.6 MPa and 2.98 MPa, respectively, while peak strain decreased from ~15% in the fresh state to 3.35% at full drying. Maximum shrinkage ratios reached 26.7% for mass and 14.5% for width. ANOVA confirmed that drying time was the dominant factor governing all mechanical properties (p < 0.001), while infill pattern (grid-like vs. cross-hatch) exerted no statistically significant effect (p > 0.05).
Discussion
These results highlight that print parameters must be carefully tailored to the specific rheological properties of the raw material to prevent structural failure. The sensitivity to moisture and infill density underscores the need for process control in clay-based 3D printing, bridging material science with digital fabrication for sustainable construction applications.
Conclusion
These findings provide a quantitative mechanical framework for 3D-printable Benjellik clay paste, supporting its use in sustainable additive manufacturing applications and offering model parameters directly applicable to buildability assessment.
1. INTRODUCTION
The emergence of additive manufacturing, widely known as 3D printing, has transformed multiple industries by facilitating the fabrication of intricate geometries with exceptional precision and reduced material waste [1-5]. This technology excels in applications requiring customization, rapid prototyping, and complex lightweight structures [6, 7], making it particularly valuable in aerospace, biomedical engineering, and automotive sectors.
Within the diverse range of materials employed in 3D printing, clay appeared to be a particularly compelling option, owing to its widespread availability, eco-friendly properties, and deep-rooted heritage in traditional craftsmanship. Notably, 3D clay printing has unlocked innovative possibilities across art, architecture, and engineering, enabling the production of highly detailed and bespoke ceramic constructs, as it is widely reported in the literature [1, 2, 8-18].
The success of 3D concrete printing (3DCP) depends on three essential aspects, namely pumpability, extrudability, and buildability [14]. Pumpability refers to the efficient transport of the material through pipes without segregation and is particularly important for large-scale printing. It relies on well-balanced rheological properties, such as low viscosity and dynamic yield stress, as well as proper aggregate-to-binder ratios [19, 20]. Extrudability involves the smooth and controlled flow of material through the nozzle, influenced by factors like nozzle geometry, thixotropic behavior, and the use of additives such as superplasticizers and fibers [21, 22] or organic additives inspired by ancient construction practices [23]. Buildability focuses on ensuring the structural stability of the printed object by promoting strong interlayer bonding, maintaining appropriate process parameters (e.g., printing speed and nozzle height), and enabling quick yield stress recovery so that each layer can support the next [24, 25]. Common defects in 3DCP include pumpability issues like segregation and pipe blockages, extrudability problems such as nozzle clogging, and buildability-related failures including plastic collapse, elastic buckling, poor interlayer adhesion, and shrinkage cracks [26-28]. These defects are strongly influenced by material composition (e.g., binder type, aggregate-binder ratio, water-binder ratio, fiber content, additive dosage), and environmental factors (e.g., temperature, relative humidity).
In the context of traditional materials such as clay, the mineralogical, physicochemical, and shrinkage characteristics of clayey marl sourced from the Benjellik site have been thoroughly investigated through X-ray diffraction (XRD), Fourier transform infrared spectroscopy (FTIR), and Brunauer–Emmett–Teller (BET) surface area analysis [29-36]. However, the mechanical properties of these clays remain insufficiently documented in the existing literature, posing a significant limitation for the structural design of 3D-printed masonry elements and for the proper evaluation of their buildability performance.
To address this shortcoming, the present study proposes a comprehensive experimental methodology to evaluate the key mechanical properties of a 3D-printable clay paste derived from Benjellik clay. Specifically, the investigation focuses on determining Young’s modulus, yield stress, and corresponding strains; analysing the evolution of shrinkage and mechanical behavior of the green state and during the drying process; examining fracture modes of the solid state; and assessing the potential influence of different infill patterns on the material’s mechanical performance. The original contributions of this work are threefold: (i) first mechanical characterization of Benjellik clay paste under 3D printing conditions, bridging a documented gap in the existing literature on Fez-Moroccan clays; (ii) a novel video-based surface-area correction method for fresh-state compressive testing of large-deformation clay specimens; and (iii) a time-resolved mechanical dataset with fitted exponential models providing parameters directly applicable to structural buildability assessment of 3D-printed clay components ultimately contributing to sustainable construction practices through the use of locally sourced, low-carbon raw materials.
2. MATERIALS AND METHODS
2.1. Materials
The mineralogical and physicochemical properties of the clayey marl extracted from the Benjellik site were extensively characterized using XRD, FTIR, and BET analysis [33].
XRD analysis revealed that the clay primarily consists of quartz, calcite, and phyllosilicates such as illite, kaolinite, and chlorite, with well-defined crystalline peaks indicating high crystallinity [30-33, 35]. The XRD diffractogram also identified specific Miller indices and Bragg distances for each crystalline phase, confirming the presence of these minerals [37, 38].
Previous FTIR spectroscopy further confirmed the presence of hydroxyl (OH) groups associated with adsorbed water, as well as structural vibrations of Al-OH and Si-OH bonds, characteristic of kaolinite and illite [39-42]. Additionally, the FTIR spectrum revealed asymmetric stretching vibrations of Si-O bonds and bending vibrations of Si-O-Si, Si-O-Mg, and Si-O-Al bonds, indicating the layered structure of the clay minerals. The presence of carbonates was also confirmed by specific absorption bands corresponding to O-C-O group vibrations.
In a previous study [14], BET analysis demonstrated that the clay has a mesoporous structure with a specific surface area of 28.21 m2/g and an average pore diameter of 101.492 Å. The nitrogen adsorption-desorption isotherm exhibited a type IV pattern, typical of mesoporous materials, with a hysteresis loop indicating the presence of both macro- and microporosity. The pore size distribution further confirmed the presence of micropores, mesopores, and some macropores, aligning with previous studies on Moroccan clays [34, 43].
The physicochemical properties of Fez-Moroccan clays, summarized in Table 1, include Atterberg limits (plastic and liquid limits, plasticity index), specific surface area, cation exchange capacity, and bulk density. These parameters are critical for assessing the clay's workability, reactivity, and structural behavior, essential for its application in construction and industrial processes, while the best extrudability was previously determined by [33] at 36% of the liquid limit.
| Physicochemical Parameters | Values |
|---|---|
| Plastic limit (%) | 20 |
| Liquid limit (%) | 36 – 56 |
| Plasticity index (%) | 16 – 36 |
| Specific Surface Area SSA (m2/g) | 35.1 |
| Cation Exchange Capacity CEC (meq/100 g) | 10.08 |
| Water content (wt%) | 20.63 |
| Total organic content (%) | 3 |
| Bulk density (g/cm3) | 2.62 |
| pH | 8 |
2.2. Methods
This part details the experimental methodology, encompassing clay paste formulation and preparation, 3D printing parameters and system specifications, the designed experimental matrix for sample fabrication, and post-processing characterization protocols. The latter includes shrinkage analysis and the cross-sectional area correction methodology implemented for accurate stress computation in fresh-state compressive testing.
2.2.1. 3D Printable Paste Preparation
The clayey paste for 3D printing is synthesized through a systematic protocol to ensure homogeneity, rheological stability, and printability. Raw marl blocks were extracted, crushed, and dried (105°C, 24 h) to eliminate moisture and facilitate grinding. The material is pulverized using a Retsch Mortar Grinder RM 200 and sieved through a 212 µm mesh to ensure fine particles. The powder is sampled and analyzed via MICROTRAC Camsizer X2 laser granulometry for precise size distribution as detailed in 2.3.1. A paste is formulated with 72.73% marl powder and 27.27% water (water/binder ratio W/B: 37.5%), optimized for extrudability and structural cohesion. After 5 min of mixing, the paste rested for 24 h under sealed conditions to equilibrate hydration.
This protocol, depicted in the first block diagram of the global workflow in 2.4, ensures controlled rheological properties critical for successful extrusion-based 3D printing, as discussed and stated in [15, 33, 44].
2.2.2. 3D Printing and Molding
This investigation adopted a dual approach to fabricate 40 mm cubes as recommended for cementitious materials. First, 3D clay printing for experimental samples and conventional molding in side-opening molds for reference specimens were adopted. For 3D printing, two infill strategies were implemented using optimized parameters in Table 2. A single solid contour wall is applied to all printed samples to ensure dimensional accuracy and surface integrity. The layer height-to-nozzle ratio is fixed at a value of 0.5 according to literature recommendations [44, 45] and preliminary fast-tuning trials.
| Slicing Parameter | Value |
|---|---|
| Printing speed | 650 mm/min |
| Nozzle diameter | 4 mm |
| Layer height | 2 mm |
| Number of layers | 20 |
| Solid contour walls | 1 |
The studied infill patterns are:
-
Grid-like Infill (GL): Alternating layers at 0° and 90°, forming a grid structure (Fig. 1a).
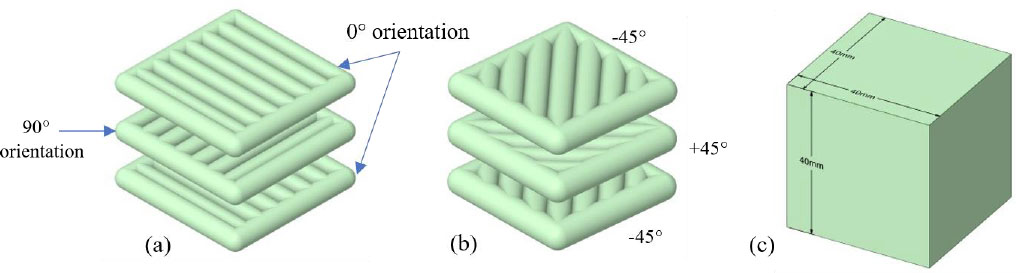 Fig. (1).
3D numerical model of the two infill strategies for 3D clay printing and molding of 40 mm cubes. (a) Grid-Like Infill (GL), (b) Diagonal Cross-Hatch Infill (CH), (c) Molded samples.
- Cross-hatch Infill (CH): Layers oriented at ±45°, creating a cross-hatched pattern (Fig. 1b).
Additionally, molded specimens were fabricated as a comparative reference (Fig. 1c).
G-codes were generated using Simplify 3D software, including a 20 mm offset contour skirt to stabilize extrusion initiation. The 3D PotterBot 10 Micro printer (Fig. 2), equipped with a piston extruder, ensured precision and reproducibility in material deposition. The printer’s characteristics are given in Table 3.
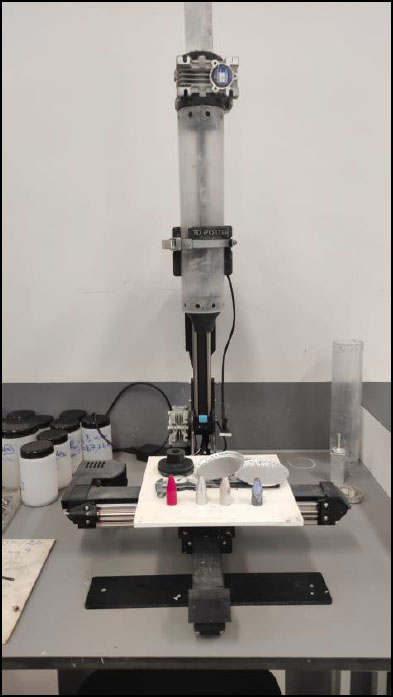
3D PotterBot 10 micro.
| Parameter | Value |
|---|---|
| Max Printing volume | 1000 ml |
| Printing Envelope | X-280 mm |
| Y-265 mm | |
| Z-305 mm | |
| Printer bed size | 266 mm x 266 mm |
| Max print speed | 130 mm/s |
| Nozzle diameters | 3, 4, 5, and 6mm |
To ensure isotropic reference samples for comparative analysis, the clay paste is molded into side-opening steel molds using a meticulous protocol. The paste is first applied to the mold’s base and corners to minimize air entrapment, followed by incremental layer-by-layer filling of the center to further reduce voids. Each layer is compacted by gently tapping and vibrating the mold exterior, facilitating air release and enhancing homogeneity. Finally, the surface is leveled using a flat-edged ruler to achieve uniform thickness and a smooth finish.
Molded specimens serve as a process-free quasi-isotropic mechanical reference. Apparent density was computed from mass, and volumetric shrinkage measurements for all categories, and their evolution with mechanical properties, are analyzed in 4.3. Direct microstructural characterization (SEM, X-ray tomography) was not feasible in this study and is recommended for future work.
2.2.3. Design of Experiments
This study adopts a full factorial experimental design to evaluate the time-dependent effects of manufacturing procedures and air-drying time (0, 3, 7, 14, 21 days) on the shrinkage behavior and mechanical properties of 3D-printed and molded clay cubes (Fig. 1c).
The design of experiment (DoE) includes three sample categories: Grid-Like (GL), Cross-Hatch (CH), and Molded (M) reference cubes, each tested at five drying time intervals as depicted in Table 4. The freshly manufactured samples (0 days) establish initial properties, while subsequent intervals track progressive drying-induced stiffness development and strength evolution.
Table 4.
| Sample TAG | Infill Pattern | Drying Time (days) |
|---|---|---|
| GL-1 | Grid-Like | 0 |
| GL-2 | Grid-Like | 3 |
| GL-3 | Grid-Like | 7 |
| GL-4 | Grid-Like | 14 |
| GL-5 | Grid-Like | 21 |
| CH-1 | Cross-Hatch | 0 |
| CH-2 | Cross-Hatch | 3 |
| CH-3 | Cross-Hatch | 7 |
| CH-4 | Cross-Hatch | 14 |
| CH-5 | Cross-Hatch | 21 |
| M-1 | Molded | 0 |
| M-2 | Molded | 3 |
| M-3 | Molded | 7 |
| M-4 | Molded | 14 |
| M-5 | Molded | 21 |
The integration of molded samples (M-1 to M-5) serves as a quasi-isotropic control to disentangle the a priori anisotropic effects in layered 3D printing. By testing all combinations of infill patterns and drying durations, this DoE enables robust analysis of time-dependent material behavior, critical for understanding the interplay between infill strategies, drying kinetics, and mechanical performance in 3D-printed bulky clay components.
Three specimens were fabricated and tested per experimental condition, yielding 45 specimens in total (5 drying intervals × 3 categories × 3 replicates). The mechanical properties presented in the Results give the mean values of the three replicates per condition. For the two-way ANOVA analysis of hardened properties, fresh-state specimens (Day 0) were excluded, resulting in 12 mean observations entering the analysis (3 infill strategies × 4 drying times). The use of mean values as ANOVA entries is consistent with the exploratory nature of this characterization study, and inter-replicate variability is quantified in 4.3.3 below.
The following parts present a comprehensive geometrical analysis of the cube specimens used in uniaxial compressive testing (UCT). 2.2.4 introduces a surface area correction method designed to account for barrelling effects in fresh specimens, ensuring a more accurate representation of the likely true-stress evaluation. 2.2.5 focuses on shrinkage analysis over time, which aims to refine the cross-sectional measurements of the cube samples, thereby enhancing the precision of stress calculations for air-dried samples.
2.2.4. Surface Area Correction for Fresh UCT
In this study, a semi-automatic MATLAB-based procedure is employed to correct the surface area of 3D-printed clay samples during fresh UCT (Fig. 3a). The process involves video recording of the specimen during testing and frame processing to estimate the deformed cross-sectional area illustrated in Fig. (3b), as described in the following procedure:
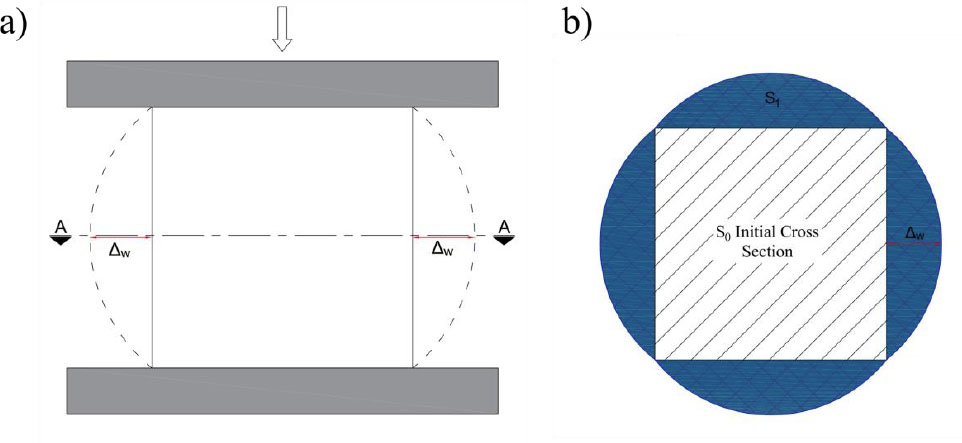
Surface area correction for fresh specimens. a) Vertical view of the compression test. b) Cross-section A-A of the specimen under compression.
- Frame calibration to convert pixel measurements to millimetres;
- Manual capture of vertical and horizontal edges of the specimen during the test at predefined frame intervals for vertical and horizontal strain computations ϵv and ϵh as indicated in Eqs. (1) and (2);
- Computation of the barrelling factor (BF) as indicated in Eq. (3);
- Computation of the corrected surface S1 area by adding to the initial cross-section area S0 4 disk segment areas of chord L 0 and sagitta
 as depicted in Fig. (3);


Where:
- L0 is the initial side of the cubic specimen, equal to 40 mm;
- h is the current height of the specimen under compression;
- L is the current width of the specimen under compression;
Note that h ≤ L0 and L ≥ L0 during testing. The barrelling factor is interpreted as a generalisation of Poisson’s ratio in plastic deformation.
2.2.5. Shrinkage Analysis
To quantify dimensional changes during drying, all specimens underwent daily shrinkage measurements. For each sample, four height measurements (h1, h2, h3, h4), two width measurements (w1,w2), and two diagonal measurements (d1,d2) were obtained at mid-height (corresponding to the 10th layer for 3D-printed cubes) as depicted in Fig. (4). These dimensions are averaged to compute the shrinkage ratio relative to the initial (Day 0) values, using Eq. (4).
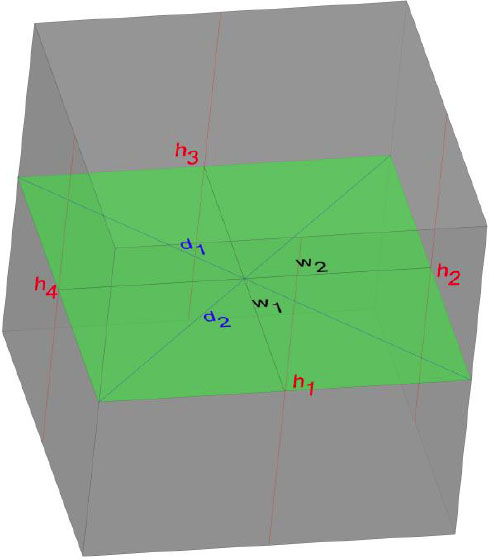
Measured dimensions for shrinkage analysis.

Where D0 is the initial mean dimension at day 0, and Dt is the mean dimension at time? t.
During drying, temperature and relative humidity are recorded with a thermometer and a hygrometer; dimension measurements are taken via a digital caliper with a precision of 0.01 mm. Measurements were reported by the same operator to minimize variability.
The shrinkage measurements provide critical data on the dimensional changes of samples during the drying process; these measurements are essential for correcting the sample cross-sectional area, ensuring accurate stress calculations during uniaxial compressive tests. Mass shrinkage measurements serve as a macroscopic proxy for moisture state evolution, providing an indirect time-resolved indicator of drying progress rather than a direct quantification of moisture transport through the specimen.
2.3. Material Testing Procedures
2.3.1. Particle Size and Shape Analysis
The particle size and shape distribution of marl powder, sieved to a 212 µm cut-off and sampled, are characterized using Dynamic Image Analysis (DIA) with a MICROTRAC CAMSIZER X2 system. A dual-camera configuration is employed to simultaneously capture high-resolution images of fine and coarse fractions (0.8 µm–8 mm range). The dry dispersion module (X-Jet) is selected to ensure complete deagglomeration while minimizing particle fracture.
Particle size and shape parameters (aspect ratio, symmetry, sphericity) are calculated using algorithms to quantify the morphology of clay powder.
2.3.2. Uniaxial Compressive Tests
Uniaxial compressive tests were performed using an MTS Criterion C45 universal testing machine; displacement-controlled tests were conducted at a rate of 0.1 mm/s on 40 mm-height specimens, resulting in a strain rate of 0.0025 s−1, ensuring quasi-static conditions well below the recommended maximum of 0.1 s−1 [46, 47]. In the absence of established testing standards for clay-based printable pastes, the 40 mm cube geometry was adopted following cementitious material guidelines [26, 27], a practice commonly used in the emerging 3D clay printing literature. A 10 kN load cell was used to record current strength measurements, while a fixed camera captured sample deformation for subsequent video processing in 2.2.4. To minimize slippage, samples were held between two rough aluminum platens, ensuring non-slipping boundary conditions to reach a quasi-pure vertical deformation.
2.4. Global Workflow
The general workflow for this study is illustrated in Fig. (5). The printable paste preparation is outlined in the first block, following the methodology described in 2.2.1, which includes particle shape and size distribution analysis of the material’s powder, as detailed in 2.3.1. Subsequently, cubic specimens are designed in accordance with the Design of Experiments (DoE) in 2.2.3 and fabricated via molding and 3D printing, as specified in 2.2.2. Visual inspection during manufacturing is critical to mitigate defects that could compromise mechanical analysis. Dimensional measurements, as described in 2.2.5, are conducted daily on defect-free samples until testing. Uniaxial compression tests are then performed on both fresh and dry specimens following the protocols in 2.3.2, with controlled failure modes to ensure compressive rupture. Finally, the mechanical properties are analysed and interpreted based on the DoE framework and comparative literature benchmark.
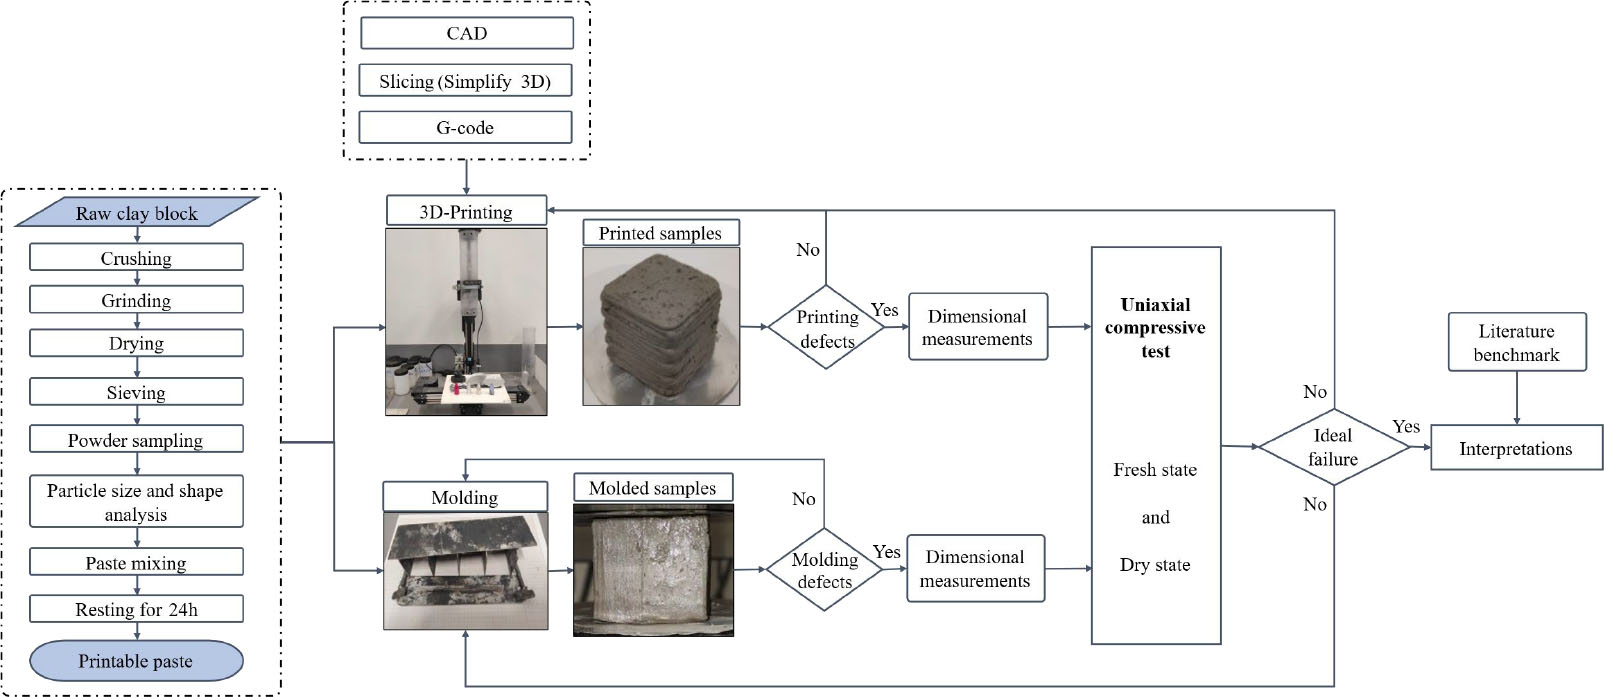
General workflow of the study.
3. RESULTS AND DISCUSSION
This part presents the key findings related to the 3D-printable clay's particle characteristics, printing process, shrinkage evolution, and mechanical performance. Uniaxial compression tests reveal drying-time-dependent property evolution, with failure analysis and statistical validation that provide insights into material behavior. Benchmarking confirms consistency with existing research on similar materials.
3.1. Laser Granulometry Results
The clayey marl powder analyzed in this study, consistent with prior research [33, 44] underwent rigorous particle size and shape characterization using the MICROTRAC CAMSIZER X2. A 100g sample of the powder obtained by quartering was analyzed, since the maximum particle size is below 2 mm. The Particle size distribution P3 and cumulative distribution Q3 plotted in Fig. (6) revealed a clay fraction (<2 µm) of 13.7%, aligning closely with Akhrif et al.’s 15.3% [33], while 90% of particles fell below 120.02 µm, comparable to Akhrif et al.’s 117.7 µm [33]. Rihani et al. [44] employed 150 size classes for finer resolution, yielding a log-normal distribution (mean: 3.46 µm; SD: 1.27). Both studies reported leptokurtic distributions (kurtosis >3) with positive skewness (1.22–1.87), indicative of finely ground powders dominated by sub-100 µm particles. The key particle size characteristics are reported in Table 5.
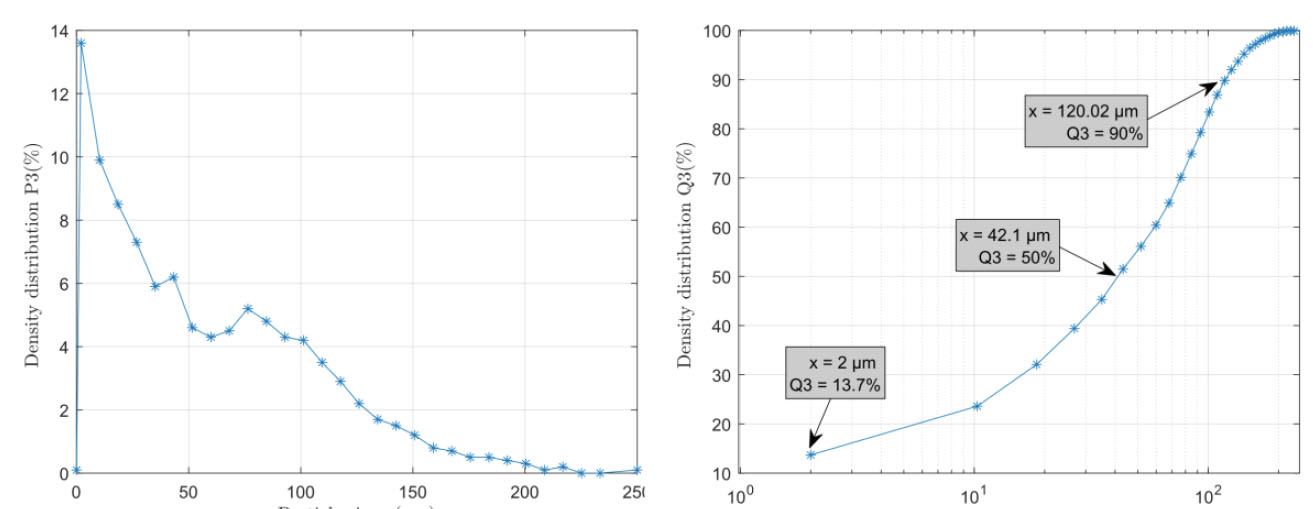
Particle size and cumulative distributions.
Shape parameters, quantified using roundness calculated based on the definitions of [48-51] and symmetry/aspect ratios, revealed that 66.91% of particles exhibited roundness ≥0.9 (mean: 0.82), while 88.31% had an aspect ratio ≥0.9 (mean: 0.75). These results closely mirrored Rihani et al.’s [44] findings (mean roundness: 0.83; symmetry ratio: 0.91), suggesting consistent particle morphology across studies.
The shape analysis revealed in this study that 66.91% of the particles have a roundness of 0.9, calculated based on the definitions of [48-51] 39.30% of particles exhibit a symmetry ratio of 0.9, and 88.31% of particles present an aspect ratio of 0.9. The analysis showed that the mean roundness of powder particles is 0.82, with a mean symmetry ratio of 0.906 and a mean aspect ratio of around 0.75. These values are very close to those of Rihani et al. [44] analysis that showed a mean roundness of 0.83 and a mean symmetry ratio of 0.90.
3.1.1. Particle Size and Shape Effect on Moisturization
Particle size and shape critically influence the moisturization capacity of marl powder; finer particles (<2 µm) possess higher surface-to-volume ratios, enhancing water adsorption [52, 53]. However, excessive fines may promote agglomeration, potentially hindering uniform hydration. The predominance of rounded particles (mean roundness: 0.82) suggests smoother surfaces, which reduce interparticle friction and facilitate water penetration. Conversely, lower aspect ratios (mean: 0.755) imply less elongation, promoting tighter packing and reducing pore space for water retention. Based on the aforementioned analysis, it is worthwhile to overcome such undesirable effects. Hence, the marl paste was rigorously mixed and allowed to rest for 24 hours in a plastic film for complete hydration.
3.1.2. Particle Size and Shape Affect the Mechanical Properties of Clayey Paste
The particle size distribution and shape parameters were previously observed to affect the paste’s mechanical behavior; a leptokurtic distribution with positive skewness indicates a high proportion of fine particles, which can enhance packing density and cohesion but may compromise strength due to reduced interlocking [54]. Rounded particles (high symmetry and roundness) diminish mechanical interlocking, potentially lowering shear strength, while the residual angularity may mitigate this effect by creating localized stress concentrations [55]. Subsequently, the balance between these factors likely governs the paste’s rheological and compressive properties, as observed in analogous clay-cement systems [56].
This discussion suggests that the shear yield stress of the paste will likely be low, given that the powder exhibits a high proportion of fine particles with a spherical and relatively symmetrical morphology. This effect is further compounded by the water content, which predominantly influences the rheological properties of the paste.
3.2. 3D Printed Marl Samples
This part outlines the 3D printing process and examines common defects in light of previous research on clay and cementitious additive manufacturing imperfections. Figure 7a and b depict the printing process for the Diagonal Cross-Hatch (CH) and Grid-Like (GL) infill patterns, respectively, with skirts added around the samples to ensure consistent material flow before starting the main print. The red lines indicate the specific infill orientations for each strategy. Aluminium plates were employed as a printing surface so that the first layer adheres to the printing bed; these plates also enable easy transportation and handling of the prints from the 3D printer to the drying area, ensuring minimal disturbance to the fresh clay sample.
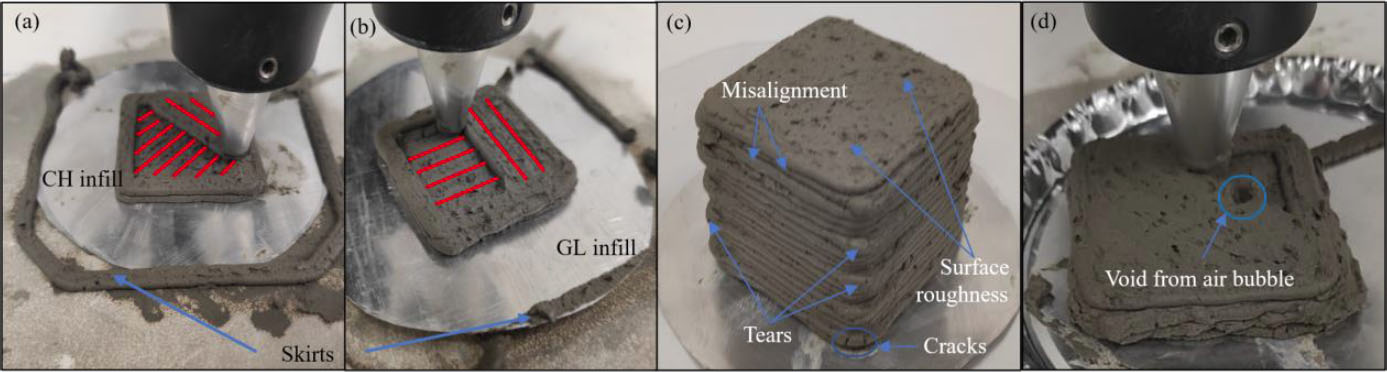
3D clay printing of samples with different infill strategies. (a)Grid-Like (GL) Infill, (b)Cross-Hatch (CH) Infill, (c) fully printed cubic sample with minor defect, (d) Major defect during deposition.
In Figure 7c, a fully printed sample is depicted, revealing 4 minor defects:
- Layer Misalignment: Some layers show slight misalignment, especially near the top of the print. This could be attributed to minor inconsistencies in material flow [24];
- Surface Roughness: The sample’s surface displays noticeable roughness, a common outcome in clay printing [17] suggesting that the paste is subjected to considerable shearing at the nozzle orifice;
- Tearing at Corners: The sample exhibits tearing at its corners, where the material tends to accumulate as the nozzle decelerates during directional changes. This is a typical issue in 3D printing, especially when sharp or frequent turns are required [26];
- Layer Settling and Deformation: The lower layers of the sample show signs of settling and slight deformation, caused by the weight of the upper layers compressing them. This phenomenon is more pronounced in clay printing due to the material’s softness, where the wet clay at the bottom must support the increasing weight of subsequent layers, leading to potential sagging or cracking [26];
The air bubbles trapped within the extruder during clay-based 3D printing manifest as internal voids in the printed specimen (Fig 7d), potentially compromising the structural integrity. These voids act as stress concentration points and crack initiation sites, reducing load-bearing capacity. To mitigate their formation, optimal extruder filling techniques must be employed to minimize air entrapment, coupled with real-time visual monitoring to detect bubble formation during the deposition process. Additionally, maintaining a nozzle diameter-to-layer height ratio of 0.5 results in flattened material deposition and can effectively minimize void formation at interlayer junctions [57].
In addition, it is noteworthy that external defect detection can be automated via machine vision and image processing as proposed by Zhou et al. [58]. Conversely, internal defects or voids are hard to detect, but a local density measurement installed on the extruder can detect density variation and then infer the potential internal issues that can emerge during printing.
3.3. Shrinkage Trends
During the drying period, environmental conditions fluctuated between 23–34°C and 41–78% relative humidity (RH), reflecting natural variations in temperature and moisture content in a non-controlled printing environment. Shrinkage measurements were performed on three specimens per condition; the values reported below represent the mean of these three replicates, ensuring measurement repeatability.
Shrinkage ratios (r) for mass, height, width, and diagonal dimensions were calculated according to Eq. (4) and plotted as functions of drying time, respectively, in Fig. (8a-d). The simplest exponential model, in Eq. (5), was fitted to the 21-day data; the resulting asymptotic shrinkage (K), rate constants (τ), and shrinkage rates (K⋅τ) are presented in Appendix 1. The maximum shrinkage ratios (rmax) reached 26.7% for mass and 14.5% for width in 3D-printed samples, with high goodness-of-fit (R-squared > 97%) across all datasets.
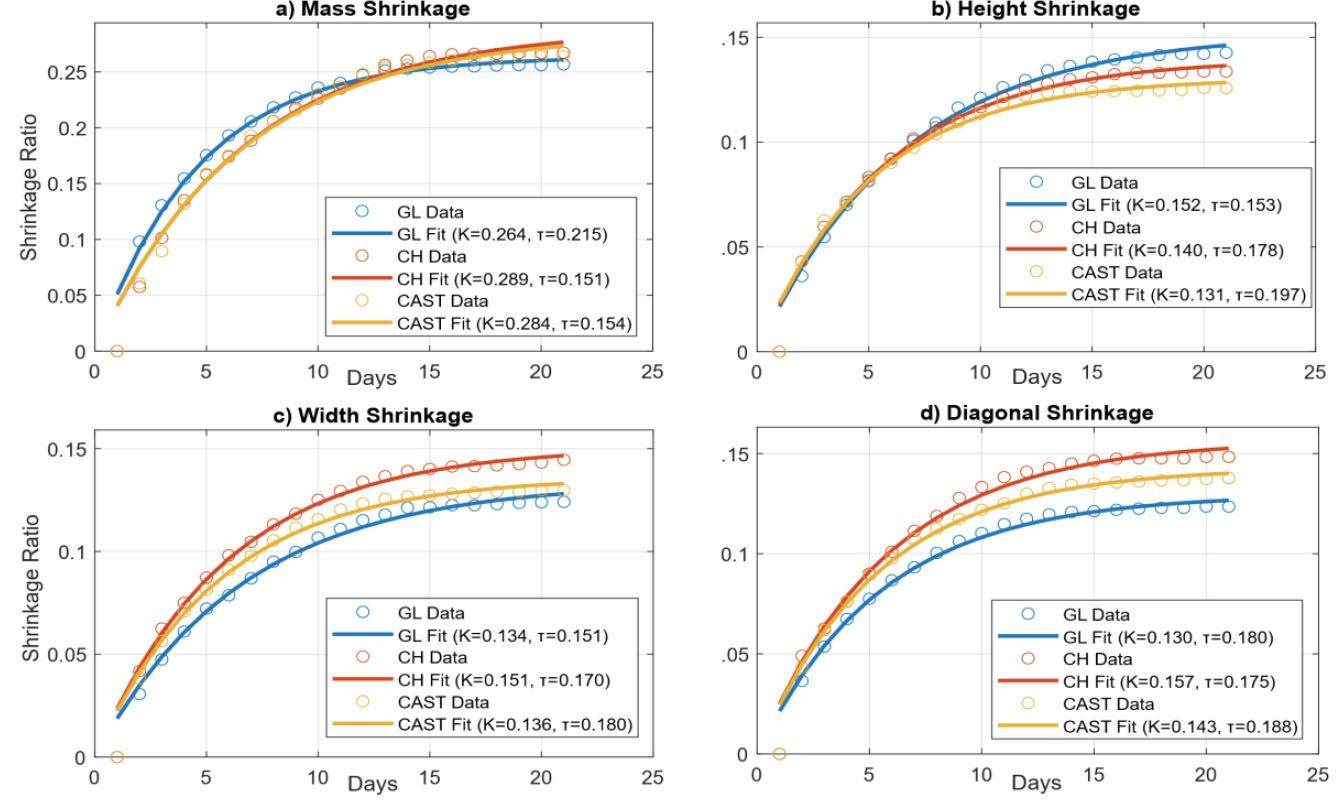
Shrinkage trends, a) Mass shrinkage, b) Height shrinkage, c) width shrinkage, d) diagonal shrinkage.

No statistically significant differences in shrinkage were observed between cross-hatch (CH) and grid-like (GL) infill patterns (Table 14-A1, Appendix 1). For instance, width shrinkage rates (K⋅τ) for CH (2.6%/day) and GL (2.10%/day) cubes differed by less than 0.5%/day, while molded specimens exhibited intermediate behavior (2,5%/day). The apparent density of each specimen, computed from mass and volumetric shrinkage measurements at each drying interval, is reported in Table 15-A1 (Appendix 1) for all fabrication categories. The evolution of mechanical properties with respect to apparent density is analyzed below.
A comparative analysis with Akhrif et al. (2025) [33] highlights the role of geometry in shrinkage dynamics (Table 6). While filled cubes exhibited moderate shrinkage rates (K⋅τ = 2,1 to 2,6%/day), single-wall cylinders (50 × 50 mm) displayed significantly higher rates (K⋅τ = 12,7%/day). The observed disparity in shrinkage behavior arises from fundamental differences in drying kinetics discussed in [59, 60]. The hollow single-wall cylinder exhibits a larger surface area-to-volume ratio than the bulk cube, increasing the contact area for moisture evaporation with shorter dissection paths. Furthermore, the bulk material can show less shrinkage due to internal matter resistance compared to void shapes.
| Sample | Dimension | Asymptotic Shrinkage K (%) | Rate Constant (days-1) | Shrinkage Rate K* (%/days) | Reference |
|---|---|---|---|---|---|
| GL cube | Width | 13.37% | 0.151 | 2,1 | This study |
| CH cube | Width | 15.08% | 0.170 | 2,6 | This study |
| Molded cube | Width | 13.60% | 0.180 | 2,5 | This study |
| Single wall cylinder (50x50) | Diameter | 14.57% | 0.870 | 12,7 | [33] |
3.4. Uniaxial Compressive Tests and Interpretation
This part outlines the results of uniaxial compressive tests on fresh and dried clay samples, evaluating the influence of infill strategies and drying time on mechanical performance via analysis of variance (ANOVA) and curve fitting. Uniaxial compressive tests were conducted on three specimens per condition in both fresh and dried states; the mechanical properties reported herein represent the mean values of the three replicates, ensuring measurement repeatability.
3.4.1. Fresh Compressive Tests
The fresh state test, also called “green state,” critically assesses the immediate post-fabricated 3D-printed clay’s mechanical properties, prior to drying or curing; this allowed evaluation of early-stage structural integrity and mechanical strength.
Unconfined Compression Tests (UCT) were performed under non-slipping boundary conditions to enforce pure vertical deformation, with no lateral slippage. Specimens with Grid-Like (GL), Diagonal Cross-Hatch (CH) infill patterns, and molded ones were tested.
Stress-strain profiles revealed nonlinear behavior, reflecting clay’s hydrous microstructure, and three distinct phases as depicted in Fig. (9):
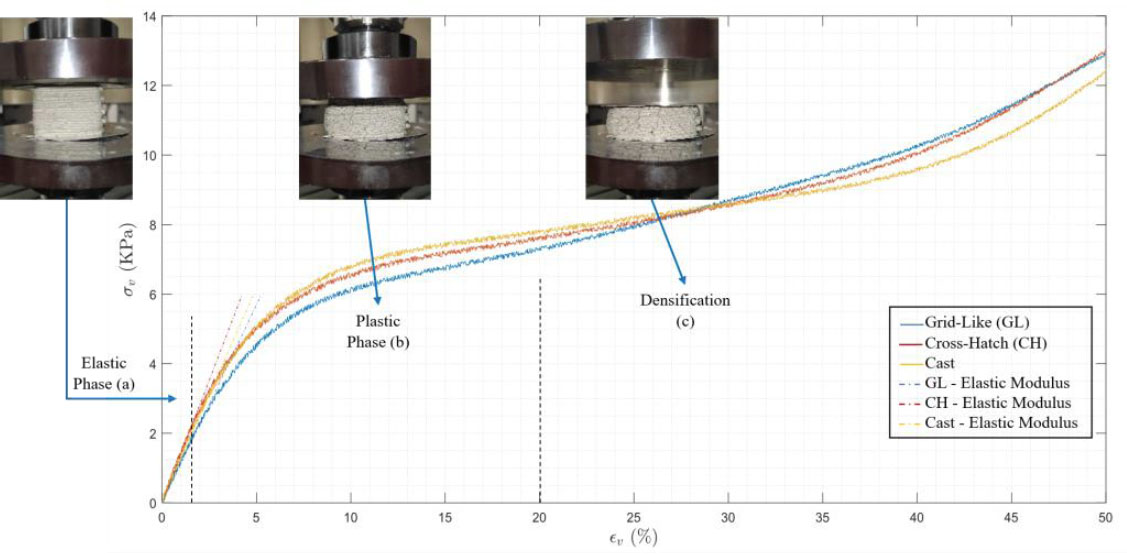
Stress-strain curves from fresh UCT of clay specimens.
- A very tight elastic phase where yielding occurs at most 2% strain;
- A plastic phase initiating strain hardening as depicted by the post-elastic concave area of the curve;
- A consolidation phase (convex region) characterized by an increase in force with minimal displacement, suggesting progressive particle compaction. This interpretation is consistent with analogous behavior reported in similar clay-based pastes [61, 62], though direct microstructural validation was beyond the scope of this study.
In Figure 10, frames from the video recording, as explained in 2.2.4, are provided at each test phase. The material initially deforms vertically under compressive load while expanding laterally due to the positive Poisson’s effect, leading to early-stage cracking. Upon reaching ~20% vertical strain, extensive surface crack propagation occurs. Crack analysis reveals inclined shear cracks, around 45° to the loading axis from the shear stress, and tensile cracks perpendicular to the loading axis, consistent with Poisson-induced lateral expansion, as visually confirmed in the video-recorded failure sequences (Fig. 10).
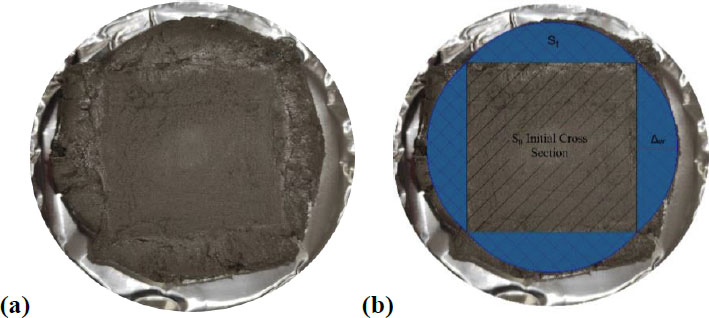
Sample analysis after fresh UCT, (a) Deformed sample, (b) Cross-section analysis of material.
Post-test analysis of the smashed specimen presented in Fig. (10a) reveals no cracking in the bulk material, and no visible material slipping at the compressed area. The lateral deformation pattern observed in the test is in close agreement with the mathematical correction of the surface area obtained via video processing from the procedure in 2.2.4 (see Fig. 10b). This correction was employed to compute the true stress-strain behavior from raw load-displacement curves provided in Fig. (15-A2) of Appendix 2.
The video-based strain analysis revealed a linear correlation between vertical and horizontal deformation, with the fitted model's slope representing the barrelling factor as reported in Table 7. This linear relationship implies that Poisson's ratio applicability extends into the plastic deformation regime in this case. Table 7 additionally summarizes Young's moduli at the elastic phase, along with yield stresses and strains. Notably, infill patterns showed negligible influence on mechanical properties.
| Sample | Young Modulus (kPa) | Yield Stress (kPa) | Yield Strain | Density (Kg/m3) | Barrelling Factor | R-Squared | p-value |
|---|---|---|---|---|---|---|---|
| GL | 115.470 | 2.27 | 1.96% | 1699.69 | 0.935 | 0.9915 | 9.53 E-32 |
| CH | 143.402 | 2.12 | 1.43% | 1711.41 | 0.852 | 0.9841 | 6.17 E-30 |
| MOLDED | 125.345 | 1.63 | 1.22% | 1680.00 | 0.908 | 0.9880 | 1.36 E-30 |
The apparent density of fresh specimens, reported in Table 7, ranges from 1680.00 kg/m3 (Molded) to 1711.41 kg/m3 (Cross-Hatch), reflecting minor fabrication-induced differences in compaction state. The slightly higher density of printed specimens (GL and CH) compared to molded ones can be attributed to the mechanical compaction exerted by the extrusion process, which promotes tighter particle packing during deposition. Despite these density differences, no systematic correlation with Young's modulus or yield stress is observed across the three categories in the fresh state, suggesting that at equivalent moisture content, the mechanical response is primarily governed by the paste's rheological state rather than by density alone. This is consistent with the dominance of hydrous interparticle interactions in fresh clay pastes reported in the literature [52, 55].
3.4.2. Dry Compressive Tests
Uniaxial compressive tests were conducted on clay cube samples, including 3D-printed specimens with grid-like (GL) and cross-hatch infill patterns, as well as molded specimens, following the dry testing procedure outlined in 2.3.2. Shrinkage data (Tables 14-A1 and 15-A1 of Appendix 1) of width and height were used to correct cross-sectional area and specimen height for accurate true stress and strain computations, a methodology aligned with practices in evaluating anisotropic materials [63]. The resulting stress-strain curves of Fig. (11) and corresponding load-displacement curves of Appendix 2, Fig. (16-A2), reveal key trends in mechanical behavior during compression tests.
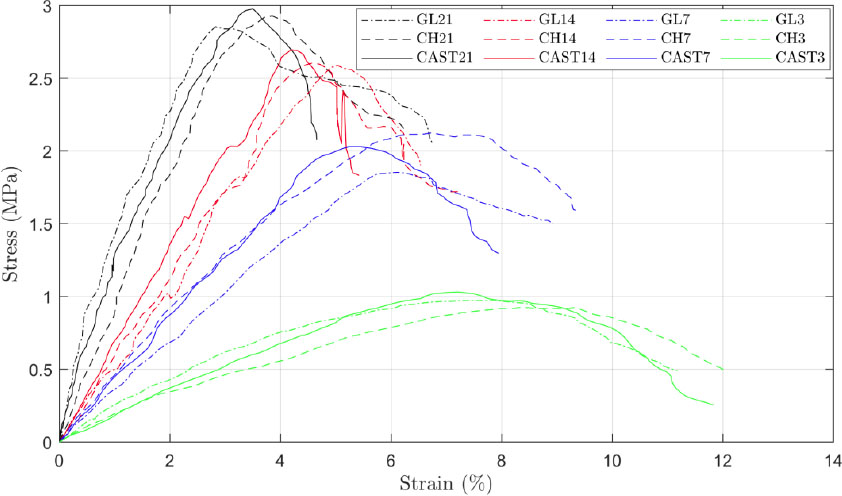
Stress-strain curves obtained from UCT for dry samples.
With increasing drying time (open-air drying), the clay exhibits a transition toward more linear stress-strain responses, accompanied by a pronounced stiffening effect - evidenced by the progressive upward shift of the curves. This behavior mirrors observations in layered rocks, where stress combinations and material anisotropy influence failure modes [64]. Additionally, the failure mode evolves from ductile to brittle fracture, as indicated by the broadening of the peak at 3 days compared to the sharp, well-defined peak at 21 days.
Similar transitions in fracture patterns under varying curing or drying conditions have been documented in studies on nano-clay stabilized soils and historical clay bricks [65]. Minor load drops in the curves suggest localized crack propagation during testing, a phenomenon consistent with crack initiation and growth mechanisms observed in layered geomaterials [64, 66]. Fracture patterns, consistent with compressive failure, are detailed in 3.5. Notably, the infill strategy had a negligible discernible influence on the stress-strain response.
The derived mechanical properties, including Young’s modulus, peak stress, and peak strain, are summarized in Table 8. These results align with experimental frameworks used to evaluate compressive strength in masonry prisms, where parameters such as brick quality and curing duration critically determine structural performance [63].
| Infill Strategy | Drying Time (Days) | Young Modulus (Mpa) | % Modulus | Peak Stresses (MPa) | % Peak Stress | Peak Strains | % Peak Strain |
Density (Kg/m3) |
|---|---|---|---|---|---|---|---|---|
| CH | 3 | 11.1 | -25.55% | 0.93 | -9.71% | 8.35% | 15.81% | 1782.91 |
| GL | 3 | 12.72 | -14.69% | 0.97 | -5.83% | 7.74% | 7.35% | 1943.61 |
| MOLDED | 3 | 14.91 | 1.03 | 7.21% | 1966.40 | |||
| CH | 7 | 44.83 | -16.89% | 2.13 | 4.93% | 5.05% | 25.31% | 1964.91 |
| GL | 7 | 42.5 | -21.21% | 1.85 | -8.87% | 4.59% | 13.90% | 1818.05 |
| MOLDED | 7 | 53.94 | 2.03 | 4.03% | 1834.19 | |||
| CH | 14 | 79.02 | -7.36% | 2.6 | -3.70% | 3.43% | 9.24% | 1944.43 |
| GL | 14 | 72.02 | -15.57% | 2.59 | -4.07% | 3.77% | 20.06% | 1917.30 |
| MOLDED | 14 | 85.3 | 2.7 | 3.14% | 1844.05 | |||
| CH | 21 | 84.67 | -4.27% | 2.93 | -1.68% | 3.85% | 10.00% | 1823.42 |
| GL | 21 | 99.89 | 12.93% | 2.85 | -4.36% | 2.82% | -19.43% | 1921.04 |
| MOLDED | 21 | 88.45 | 2.98 | 3.50% | 1888.07 |
Additionally, the relative differences between the parameters obtained for the printed samples and those of the molded reference are calculated. This analysis reveals notable variability in the mechanical properties of printed versus molded specimens. These samples exhibit significantly higher stiffness and strength compared to the printed ones, with differences reaching up to 25.55%. Similarly, the peak stress shows a 9.71% deviation, while the peak strain varies by as much as 20.06%. Furthermore, the molded specimens demonstrate substantially lower deformation than their printed counterparts.
3.4.3. Infill Strategy and Time Effect on Mechanical Properties
To further examine the effect of drying time and scanning strategy on the mechanical properties of the samples, an analysis of variance ANOVA was conducted. In this study, a two-way ANOVA was employed to assess the individual and combined effects of infill strategy (MOLDED, CH, GL) and drying time (3, 7, 14, 21 days) on three key mechanical properties:
- Young’s modulus representing the material’s stiffness;
- Peak stresses representing compressive strength of the material;
- Peak strains representing the ductility of the material;
The apparent density of dried specimens, reported in Table 8, evolves with drying time, reflecting progressive mass loss and volumetric consolidation. At early drying stages (3 days), higher density correlates with higher stiffness and strength, suggesting that compaction state contributes to early-stage mechanical performance. However, beyond 7 days, this correlation weakens - specimens with comparable densities exhibit notably different mechanical properties across fabrication categories - indicating that moisture loss and associated microstructural clay particle reorganization become the dominant governing factors, consistent with the ANOVA finding that drying time is the most significant factor (p < 0.001) for all mechanical properties.
ANOVA decomposes the total variability of the data into contributions from each factor (infill strategy, drying time) and their interaction, followed by a Fisher test to determine the statistical significance (p-value), which should be less than 5% as a rule of thumb. The ANOVA was performed at a significance level of α = 0.05. Twelve mean observations entered the analysis (3 infill strategies × 4 drying times), each representing the mean of 3 replicates per condition. Inter-replicate variability was assessed through the coefficient of variation (CV) across the three specimens per condition. CV values remained below 15% for all mechanical properties across all conditions, consistent with acceptable repeatability thresholds reported for earth-based and clay materials in the literature [67, 68].
The ANOVA results, presented in Tables 9-11, reveal that drying time is the most prominent factor influencing all three mechanical properties, exhibiting statistically significant effects (p < 0.001) on Young’s modulus, peak stresses, and peak strains. Specifically, longer drying periods substantially enhance stiffness and strength while reducing ductility, indicating a clear trade-off between these properties. In contrast, the infill strategy (MOLDED, CH, GL) demonstrates no statistically significant impact (p > 0.05 for all properties), suggesting that variations in infill patterns do not meaningfully alter mechanical performance under the tested conditions. In contrast, this result aligns well with Murica’s findings on 3D concrete printing [69]. Meanwhile, we should note that the infill pattern effect behaves differently with the materials, as it was demonstrated to be significant in polymer 3D printing, as reported by Ouazzani et al. [70].
To complement the significance testing above, partial eta-squared (η2p) effect sizes were computed from the sums of squares reported in Tables 9-11 (η2p = SSeffect / (SSeffect + SSerror)). Drying time showed very large effect sizes for all three properties (η2p = 0.980, 0.995 and 0.976 for Young's modulus, peak stress and peak strain, respectively), consistent with its dominant and statistically significant role. Infill strategy, despite not reaching statistical significance, showed moderate-to-large effect sizes for peak stress (η2p = 0.492) and peak strain (η2p = 0.522), and a smaller effect size for Young's modulus (η2p = 0.233); this contrast between a non-significant p-value and a non-negligible effect size reflects the limited statistical power associated with the low error degrees of freedom (df = 6) rather than a definitive absence of effect, and the finding should be interpreted with this caveat in mind. Regarding the interaction between infill strategy and drying time, it was not evaluated: the ANOVA was performed on the twelve condition-level means (one mean per infill strategy × drying time combination) rather than on the 45 individual replicate measurements, leaving no residual degrees of freedom available to estimate an interaction term within this design. Testing the interaction and computing confidence intervals around condition means would require re-running the analysis on the raw replicate-level dataset.
| Source | Sum Sq. | d.f | Mean Sq. | F | Prob>F |
|---|---|---|---|---|---|
| Infill strategy | 68.650 | 2 | 34.325 | 0.913 | 4.51E-01 |
| Drying time | 11015.809 | 3 | 3671.936 | 97.645 | 1.76E-05 |
| Error | 225.629 | 6 | 37.605 | - | - |
| Total | 11310.088 | 11 | - | - | - |
| Source | Sum Sq. | d.f | Mean Sq. | F | Prob>F |
|---|---|---|---|---|---|
| Infill strategy | 0.030 | 2 | 0.015 | 2.901 | 1.31E-01 |
| Drying time | 6.661 | 3 | 2.220 | 427.208 | 2.21E-07 |
| Error | 0.031 | 6 | 0.005 | - | - |
| Total | 6.722 | 11 | - | - | - |
| Source | Sum Sq. | d.f | Mean Sq. | F | Prob>F |
|---|---|---|---|---|---|
| Infill strategy | 1.002 | 2 | 0.501 | 3.271 | 1.09E-01 |
| Drying time | 38.039 | 3 | 12.680 | 82.819 | 2.84E-05 |
| Error | 0.919 | 6 | 0.153 | - | - |
| Total | 39.959 | 11 | - | - | - |
In the following, the mean effect charts are analysed to investigate the mechanical properties evolution during drying.
3.4.4. Mechanical Properties Evolution during Drying
The ANOVA results confirmed that drying time governs the evolution of mechanical properties in clay samples, while infill strategy showed negligible influence (p > 0.05 for all properties). To quantify this time dependency, exponential models were fitted to the mean values of Young’s modulus
 , peak stresses
 , and peak strains
 across all infill strategies. The models are presented in Eqs. (6-8).
Young's moduli and peak stresses, depicted in Fig. (12a and b), follow distinct exponential growth trends, reaching asymptotic values of 130.6 MPa and 3.08 MPa, respectively, with rate constants τ) of 0.06 and 0.14 days−1. These models demonstrated excellent agreement with experimental data, evinced by R2 values exceeding 95% as presented in Table 12.
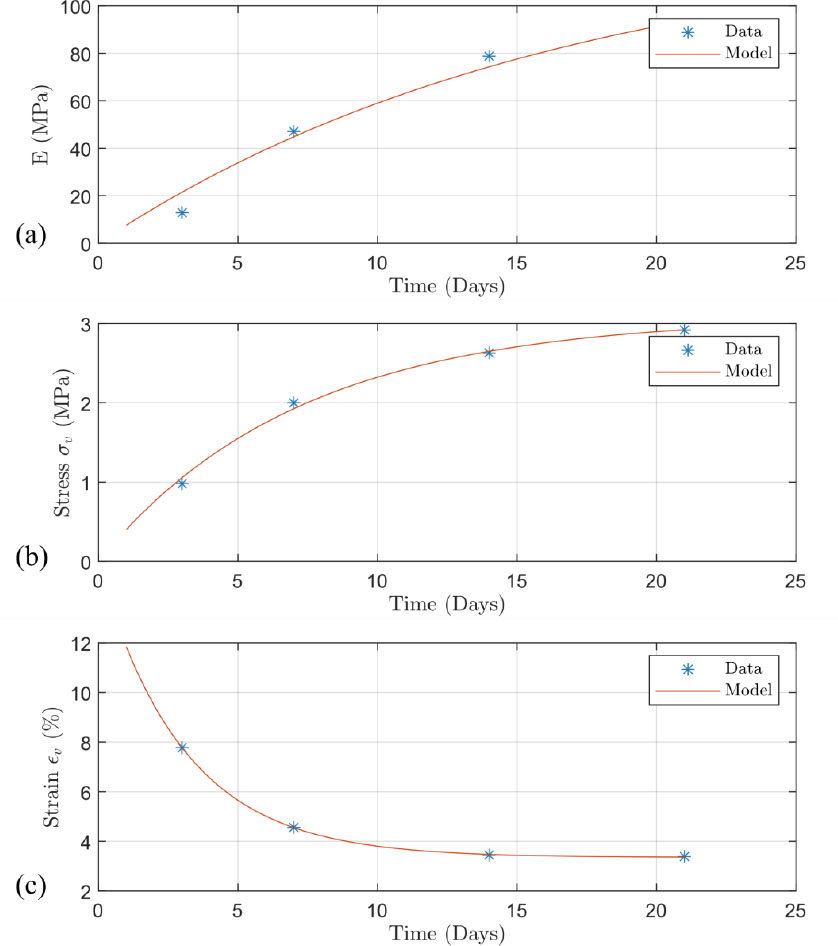
Mean effect charts and the corresponding fitting. (a) Mean young modulus, (b) mean vertical stresses, (c) mean vertical strains.
| - | Model Parameters | Fitting Quality | ||
|---|---|---|---|---|
| Mechanical Properties | Asymptotic Value | Rate Constant | R2 | RMSE |
| Young’s modulus (MPa) | Einf = 130.6 | τE = 0.06 | 95.64% | 7.302 |
| Peak stress (MPa) | σinf = 3.08 | τσ = 0.14 | 99.20% | 0.0768 |
| Peak strain (%) | ϵinf = 3.35 | τϵ = 0.32 | 99.97% | 0.0359 |
Peak strain exhibited a different behavior, following a shifted exponential decay model (Fig. 12c) with a rapid initial decrease (τϵ = 0.32 days−1) before stabilizing at 3.35% residual strain. This inverse relationship between ductility and stiffness reflects the material's progressive hardening during drying. Additionally, the extrapolation of peak strains to initial time (
 ) aligns with the range of strain at the end of the plastic phase obtained from fresh UCTs in Fig. (9).
While these models effectively describe the mid-to-late drying phases, early-age behavior (t < 1 day) reveals more complex dynamics. Chen et al. [8] observed slower initial property development; they reported convex strength-time curves in fresh clay samples during the first 240 minutes post-printing, suggesting that logistic growth models might better capture the complete drying timeline by accounting for the delayed onset of property development. This trend suggests a predominance of thixotropic effects over drying actions, as recalled by Oulkhir et al. in their systematic review [14].



3.5. Failure Behavior
Fractured samples were interpreted according to ASTM C1314. The specimens exhibit two primary failure categories under compressive loading depending on the energy release mechanism: relevant failures (axial splitting, multiple fracturing) depicted in Fig. (13a) and non-relevant (face shell separation, cone fracture, shear fracture) illustrated in Fig. (13b). Axial splitting, characterized by vertical cracks along the loading axis, occurs in high-strength samples, while multiple fracturing - interconnected crack networks - occurs in high-strength samples, reflecting quasi-brittle fracture mechanics akin to rock and concrete [71].
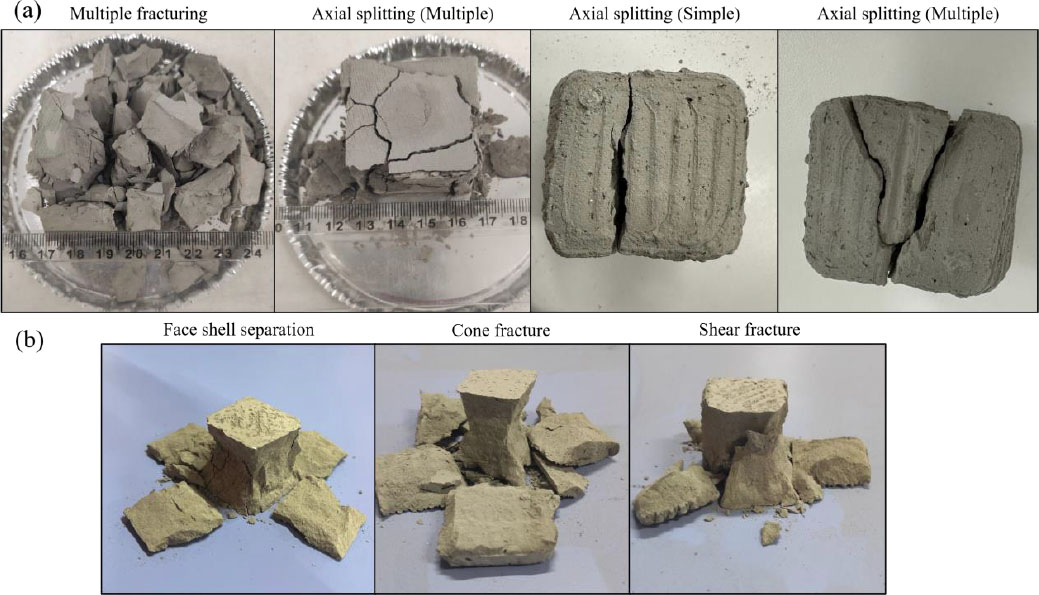
Identified failure modes. (a) relevant failure, (b) non-relevant failure.
The significance of this test lies in its ability to quantify the release of accumulated strain energy - specifically, lateral tensile stresses induced under compressive loading - through the propagation of a through-thickness crack within the bulk material of the sample. This failure mechanism reflects the intrinsic material’s response to stored energy.
Non-relevant failure mode interpretations, conversely, are based on visual inspection of fractured specimens and video-recorded compression sequences. Microstructural validation (e.g., X-ray tomography or SEM imaging) was beyond the scope of this study and is recommended for future work to confirm the proposed mechanisms. Those non-relevant failures are attributed to factors such as eccentric loading [72] often deriving from manufacturing imperfections (e.g., misaligned loading surfaces, anisotropic shrinkage during drying) or microstructural defects (e.g., voids, porosity). These defects act as stress concentrators, initiating fracture processes [73]. Tensile energy accumulation near the specimen’s surface results in secondary failure patterns, including face shell separation and cone fractures. While full constitutive calibration was not performed, the observed post-failure sliding behavior (Fig. 13b) – Shear fracture) qualitatively aligns with Mohr–Coulomb frictional mechanics [74, 75]. Such modes underscore the interplay between specimen integrity, loading conditions, and material heterogeneity.
In this context, it is important to note that there is no visible core pattern in the fractured material, which corroborates the insignificance of the infill strategy obtained from ANOVA results.
3.6. Interpretation and Benchmark
The non-significance of the filling pattern observed in this study underscores the robustness of the unconfined uniaxial compressive testing methodology, as evidenced by the repeatability of results. To contextualize the validity of the measured data, a comprehensive comparative analysis was conducted regarding established literature values (Table 13).
| Material Property | This Study | Literature Data | Reference |
|---|---|---|---|
| Fresh state | - | - | - |
| Young’s modulus (kPa) | 115.470 - 143.40 | 46.38 - 243.42 | [8] |
| Compressive yield stress (kPa) | 1.63 - 2.27 | 0.92 - 6.11 | [8] |
| Shear yield stress (kPa) | - | 0.84 - 1.76 | [33] |
| Shear yield stress (kPa) | - | 1.4 - 1.6 | [44] |
| Dry state | - | - | - |
| Young’s modulus (MPa) | 11.10 – 99.89 | 8 - 40 | [80] |
| Young’s modulus (MPa) | 11.10 - 99.89 | 20 - 80 | [81, 82] |
| Young’s modulus (MPa) | 11.10 - 99.89 | 10 - 90 | [83] |
| Compressive strength (MPa) | 0.93 – 2.98 | > 0.4 | [84] |
| Compressive strength (MPa) | 0.93 – 2.98 | > 0.1 | [85] |
| Compressive strength (MPa) | 0.93 – 2.98 | 0.69 – 2.42 | [86] |
In order to provide more understanding of the behavior of clay paste, shear yield stress derived from parallel plate rheometry tests on the same material is provided in Fig. (14). The shear yield stress values in Table 13 resulted from fitting the Windhab model in Akhrif et al. [33] and Bingham/Bulkley models in Rihani et al. [44]. These rheological models are widely used in the literature [76-78]. Conversely, the Discrete Fresh Concrete (DFC) model enables the mesoscale evaluation of fresh-state behavior in granular pastes using the Discrete Element Method (DEM) [79].
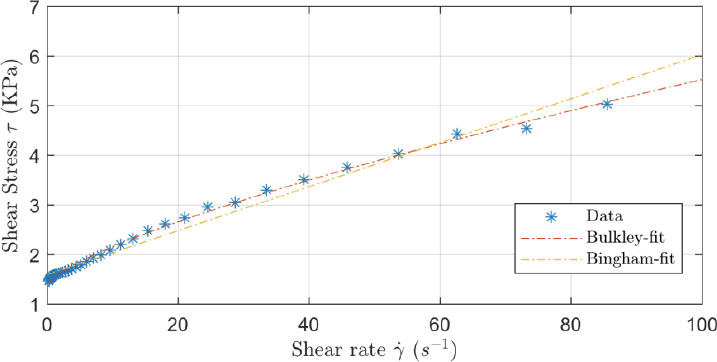
Fresh paste rheological test [44].
The provided values are notably proximate to the compressive yield stresses reported herein, suggesting a possible correlation between shear and compressive yield behavior in similar materials.
Collectively, the benchmark analysis validates the experimental data’s consistency with established literature, while observed deviations highlight the influence of methodological and material-specific factors. These findings reinforce the reliability of the proposed testing framework and provide critical insights into the mechanical behavior of the studied material across states, supporting its application in sustainable construction.
CONCLUSION
This study established a comprehensive mechanical characterization framework for a 3D-printable paste derived from Benjellik clayey marl (W/B = 37.5%), supporting its integration into sustainable construction through clay-based additive manufacturing. Particle analysis confirmed a leptokurtic size distribution dominated by sub-100 µm grains with high sphericity (mean roundness: 0.82) and symmetry (mean aspect ratio: 0.75), consistent with previously reported values for the same material. Shrinkage measurements showed dimensional stabilization after 13–15 days, with maximum mass and width shrinkage ratios of 26.7% and 14.5%, respectively, well-fitted by exponential models (R2 > 97%). Uniaxial compressive tests revealed drying-time-dependent mechanical behavior, with Young's modulus and compressive strength increasing asymptotically toward 130.6 MPa and 3.08 MPa, respectively, while peak strain decreased from ~15% in the fresh state to 3.35% at full drying; apparent density analysis further showed that compaction state governs early-stage performance while moisture loss drives property development beyond 7 days. Two-way ANOVA confirmed drying time as the dominant factor for all three mechanical properties (p < 0.001), while infill strategy (GL vs. CH) exerted no statistically significant effect (p > 0.05), consistent with the absence of infill-related patterns in the failure planes. A novel video-based surface-area correction method was developed to account for barrelling deformation in fresh-state testing, with internal consistency confirmed by self-validation checks, and benchmarking against published data validated the measured property ranges for both fresh and hardened states. Several limitations should be acknowledged — including uncontrolled drying conditions, quasi-static loading only, single clay source, no long-term durability assessment, and a restricted set of infill strategies — and future work should address these through controlled-environment testing, dynamic loading protocols, multi-source clay comparisons, durability assessments, and a broader parametric study of printing parameters.
AUTHORS’ CONTRIBUTIONS
The authors confirm contribution to the paper as follows: I.A. and N.R.: Study conception and design; N.R. and F.Z.O.: Data collection; M.E. and I.A.: Analysis and interpretation of results; N.R. and M.E.: Draft manuscript. All authors reviewed the results and approved the final version of the manuscript.
LIST OF ABBREVIATIONS
| AM | = Additive Manufacturing |
| 3DCP | = 3D Concrete Printing |
| UCT | = Uniaxial Compressive Test |
| GL | = Grid-Like infill |
| CH | = Cross-Hatch infill |
| DoE | = Design of Experiments |
| ANOVA | = Analysis of Variance |
| BF | = Barrel factor |
| W/B | = Water-to-Binder ratio |
| XRD | = X-Ray Diffraction |
| FTIR | = Fourier Transform Infrared Spectroscopy |
| BET | = Brunauer–Emmett–Teller |
| DIA | = Dynamic Image Analysis |
| RH | = Relative Humidity |
| CV | = Coefficient of Variation |
| SEM | = Scanning Electron Microscopy |
AVAILABILITY OF DATA AND MATERIALS
The data supporting the findings of this study are available from the corresponding author upon reasonable request. No publicly accessible repository was used for data storage.
FUNDING
This research was supported by the infrastructure and resources provided by Euromed University of Fez.
ACKNOWLEDGEMENTS
The authors would like to express their sincere gratitude to Euromed University of Fez for its fundamental support in the realization of this research. We specifically acknowledge the provision of access to the advanced facilities and laboratories of the research platform, which were indispensable for the experimental work.
APPENDIX
Appendix 1 Shrinkage Data table
Table 14-A1.
| Infill Strategy | Max Days | Physical Quantity | K | τ (day-1) | K x τ (day-1) | Max ri* | R2 |
|---|---|---|---|---|---|---|---|
| CH | 3 | Mass | N.A | N.A | N.A | 0.121 | N.A |
| CH | 7 | Mass | N.A | N.A | N.A | 0.189 | N.A |
| CH | 14 | Mass | N.A | N.A | N.A | 0.257 | N.A |
| CH | 21 | Mass | 0.289 | 0.151 | 0.044 | 0.267 | 98.0% |
| GL | 3 | Mass | N.A | N.A | N.A | 0.114 | N.A |
| GL | 7 | Mass | N.A | N.A | N.A | 0.206 | N.A |
| GL | 14 | Mass | N.A | N.A | N.A | 0.255 | N.A |
| GL | 21 | Mass | 0.264 | 0.215 | 0.057 | 0.257 | 96.9% |
| MOLDED | 3 | Mass | N.A | N.A | N.A | 0.108 | N.A |
| MOLDED | 7 | Mass | N.A | N.A | N.A | 0.193 | N.A |
| MOLDED | 14 | Mass | N.A | N.A | N.A | 0.252 | N.A |
| MOLDED | 21 | Mass | 0.284 | 0.154 | 0.044 | 0.264 | 97.7% |
| CH | 3 | Width | N.A | N.A | N.A | 0.051 | N.A |
| CH | 7 | Width | N.A | N.A | N.A | 0.112 | N.A |
| CH | 14 | Width | N.A | N.A | N.A | 0.141 | N.A |
| CH | 21 | Width | 0.151 | 0.17 | 0.026 | 0.145 | 98.0% |
| GL | 3 | Width | N.A | N.A | N.A | 0.058 | N.A |
| GL | 7 | Width | N.A | N.A | N.A | 0.093 | N.A |
| GL | 14 | Width | N.A | N.A | N.A | 0.134 | N.A |
| GL | 21 | Width | 0.134 | 0.151 | 0.021 | 0.124 | 98.1% |
| MOLDED | 3 | Width | N.A | N.A | N.A | 0.061 | N.A |
| MOLDED | 7 | Width | N.A | N.A | N.A | 0.088 | N.A |
| MOLDED | 14 | Width | N.A | N.A | N.A | 0.129 | N.A |
| MOLDED | 21 | Width | 0.136 | 0.18 | 0.025 | 0.13 | 97.7% |
| CH | 3 | Height | N.A | N.A | N.A | 0.071 | N.A |
| CH | 7 | Height | N.A | N.A | N.A | 0.102 | N.A |
| CH | 14 | Height | N.A | N.A | N.A | 0.131 | N.A |
| CH | 21 | Height | 0.14 | 0.178 | 0.025 | 0.134 | 97.8% |
| GL | 3 | Height | N.A | N.A | N.A | 0.068 | N.A |
| GL | 7 | Height | N.A | N.A | N.A | 0.107 | N.A |
| GL | 14 | Height | N.A | N.A | N.A | 0.133 | N.A |
| GL | 21 | Height | 0.152 | 0.153 | 0.023 | 0.143 | 98.3% |
| MOLDED | 3 | Height | N.A | N.A | N.A | 0.069 | N.A |
| MOLDED | 7 | Height | N.A | N.A | N.A | 0.097 | N.A |
| MOLDED | 14 | Height | N.A | N.A | N.A | 0.129 | N.A |
| MOLDED | 21 | Height | 0.131 | 0.197 | 0.026 | 0.126 | 97.2% |
| CH | 3 | Diagonal | N.A | N.A | N.A | 0.055 | N.A |
| CH | 7 | Diagonal | N.A | N.A | N.A | 0.121 | N.A |
| CH | 14 | Diagonal | N.A | N.A | N.A | 0.139 | N.A |
| CH | 21 | Diagonal | 0.157 | 0.175 | 0.027 | 0.148 | 97.7% |
| GL | 3 | Diagonal | N.A | N.A | N.A | 0.059 | N.A |
| GL | 7 | Diagonal | N.A | N.A | N.A | 0.098 | N.A |
| GL | 14 | Diagonal | N.A | N.A | N.A | 0.128 | N.A |
| GL | 21 | Diagonal | 0.13 | 0.18 | 0.023 | 0.124 | 97.7% |
| MOLDED | 3 | Diagonal | N.A | N.A | N.A | 0.062 | N.A |
| MOLDED | 7 | Diagonal | N.A | N.A | N.A | 0.103 | N.A |
| MOLDED | 14 | Diagonal | N.A | N.A | N.A | 0.137 | N.A |
| MOLDED | 21 | Diagonal | 0.143 | 0.188 | 0.027 | 0.138 | 97.6% |
| Infill Strategy | Time | Mass (g) | Width (mm) | Height (mm) | Volume (m3) | Density (Kg/m3) |
|---|---|---|---|---|---|---|
| CH | 3 | 95.47 | 37.96 | 37.16 | 5.355E-05 | 1782.91 |
| CH | 7 | 88.08 | 35.52 | 35.92 | 4.532E-05 | 1943.61 |
| CH | 14 | 80.70 | 34.36 | 34.76 | 4.104E-05 | 1966.40 |
| CH | 21 | 79.61 | 34.2 | 34.64 | 4.052E-05 | 1964.91 |
| GL | 3 | 96.23 | 37.68 | 37.28 | 5.293E-05 | 1818.05 |
| GL | 7 | 86.24 | 36.28 | 35.72 | 4.702E-05 | 1834.19 |
| GL | 14 | 80.91 | 34.64 | 34.68 | 4.161E-05 | 1944.43 |
| GL | 21 | 80.70 | 35.04 | 34.28 | 4.209E-05 | 1917.30 |
| MOLDED | 3 | 96.88 | 37.56 | 37.24 | 5.254E-05 | 1844.05 |
| MOLDED | 7 | 87.65 | 36.48 | 36.12 | 4.807E-05 | 1823.42 |
| MOLDED | 14 | 81.24 | 34.84 | 34.84 | 4.229E-05 | 1921.04 |
| MOLDED | 21 | 79.94 | 34.8 | 34.96 | 4.234E-05 | 1888.07 |
Appendix 2 Load Displacement Curves
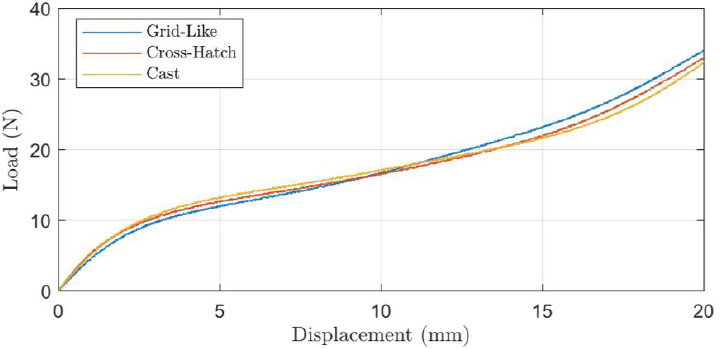
Load displacement curves for fresh state.
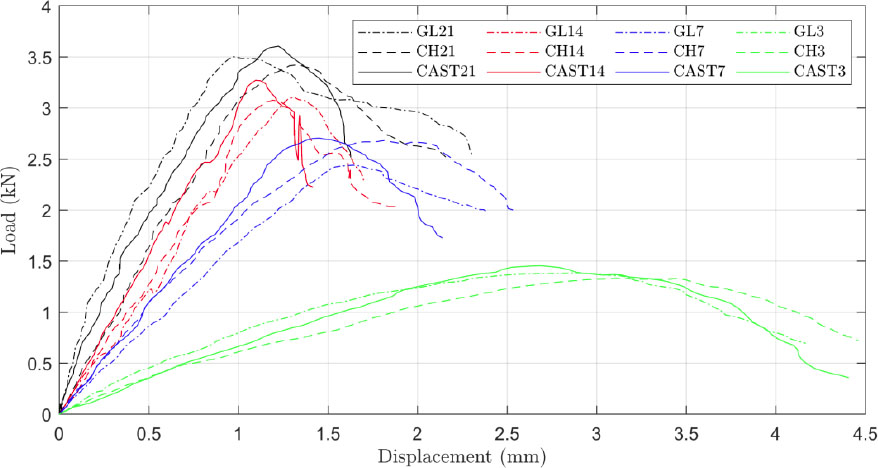
Load displacement curves for dry specimens.