All published articles of this journal are available on ScienceDirect.

From Pre-design to Operation: A Scoping Review and Bibliometric Analysis of Productivity Metrics Using BIM in Building Projects
Authors Info & Affiliations
Abstract
Background
The construction industry has been seeking ways to improve productivity through digitalization, with Building Information Modeling (BIM) emerging as a key methodology. However, the existing literature remains unclear about the relationship between BIM implementation and productivity metrics across different project stages.
Objective
This study aims to analyze productivity indicators applied in construction projects using BIM methodology and their alignment across project lifecycle stages, providing guidance for future research pathways in construction productivity.
Methods
A comprehensive scoping review was conducted using bibliometric and content analysis methods. The study analyzed 151 documents from Scopus and Web of Science databases, supplemented by gray literature. The analysis focused on identifying productivity metrics, project types, and lifecycle stages where BIM is applied.
Results
The analysis revealed that productivity indicators align better when mapped according to project lifecycle stages. Most studies (70%) focused on case studies and surveys, primarily in pre-design and construction phases. China and the United States dominated the literature (73% of publications). The research identified three main project categories: residential, commercial, and industrial/specific buildings. Productivity metrics varied by project complexity, with more complex projects showing greater emphasis on mechanical and electrical assembly team performance indicators.
Conclusion
The study demonstrates that the potential of BIM for productivity enhancement remains partially untapped, particularly in the post-construction phases. While some productivity indicators receive substantial attention, others remain under-researched. The findings suggest the need for establishing standardized productivity metrics across project lifecycles and expanding BIM application beyond traditional construction phases, particularly in the operation and maintenance stages.
1. INTRODUCTION
In recent years, the adoption of “Building Information Modeling” (BIM) has been discussed by various authors [1, 2]. BIM represents an innovative initiative aimed at addressing specific challenges in the Architecture, Engineering, And Construction (AEC) industry, such as the low productivity of labor [3, 4, 5]. The construction industry faces significant workforce challenges, with studies showing that 82 percent of construction workers experience occupational mobility [6], which can impact project productivity and quality. Succar [7] defined BIM as “a set of interrelated policies, processes, and technologies that produce a methodology for managing the essential design of a building and its project data digitally throughout the structure’s lifecycle.” Thus, the implementation of BIM needs various transformative processes and technologies within an organization [8].
Government incentives, such as the establishment of supportive legislation, have played a pivotal role in encouraging the adoption of BIM methodology in the construction industry, marking a significant stride towards modernization and efficiency [9]. The Brazilian federal government established the National BIM Dissemination Strategy in 2017, aiming to foster a conducive environment for BIM investment and its proliferation in the country as a policy to enhance the performance of the AEC industry. Despite the anticipated benefits of BIM implementation and competitive advantages, its potential remains untapped [10-14], illustrating that BIM implementation in organizations poses challenges.
Recent research highlights the importance of sustainable performance factors in construction [12]. Tayeh et al. [15] identified key economic, social, and environmental factors from the perspective of the consultants, where professional fees, energy costs, and environmental regulations stand out. This multidimensional understanding is crucial when evaluating BIM impacts across different project stages [16].
Several authors have highlighted productivity gains from BIM during project, construction, and assembly phases [17, 18, 19]. Lu et al. [20] examined productivity differences across the lifecycle stages of two projects and noted productivity enhancements during construction, offset by increased efforts during the design phase. This shift suggests a transfer of efforts from the construction to the design stage, especially concerning the reduction of interference between projects. Currently, there is no formal approach to estimating the costs of architectural and engineering services using BIM [2, 21]. Consequently, costs are projected based on the design or the experience of those involved, leading to inconsistencies. Public agencies must adhere to specific legislative requirements and need an objective foundation for budgeting items related to services using the BIM methodology [22, 23].
In this study, utilizing bibliometric and content analysis methods provided a holistic insight into the literature concerning productivity with BIM. The bibliometric approach allowed for quantitative assessment of publication trends, revealing patterns, prolific authors, and dominant journals. On the other hand, content analysis delved deep into the qualitative aspects, elucidating the nuances, emerging themes, and intricacies of the discussed topics. Together, these analyses highlighted the depth and breadth of research and underscored the complementary nature of quantitative and qualitative assessments, each offering unique perspectives that, when combined, provide a comprehensive understanding of the subject. A structured and reproducible scientific methodology was applied to extract content from the literature, aiming to understand the intellectual structure, map themes and categories concerning productivity with the BIM methodology, assess how productivity is evaluated throughout the project lifecycle, and determine the types of projects and indicators used for such evaluations. Thus, the guiding questions for this research were: i) what is the intellectual structure of the literature regarding productivity using the BIM methodology? ii) What types of projects and construction lifecycle stages use productivity analysis or evaluation using the BIM methodology? iii) What are the productivity indexes or coefficients for analyzing productivity using project modeling with the BIM methodology? and iv) what far-reaching implications will BIM have on construction productivity analysis for future research? This research makes several notable contributions to the literature on BIM and productivity. Firstly, it brings to the forefront lesser-known aspects of productivity indicators and their relevance across various project stages, enriching the existing knowledge base. Secondly, a dual-method approach offers a balanced perspective, ensuring that both quantitative trends and qualitative nuances are well captured. Lastly, the study emphasizes the significance of adopting BIM methodology across diverse project typologies, encouraging more integrated and efficient construction practices. The article proposes an introduction that provides context and highlights the significance of the study, emphasizing its relevance in the domain of BIM and productivity research. It is followed by the theoretical background, which explores current research on BIM and its relationship with productivity. The methodology section details the research techniques and procedures used for the bibliometric and content analysis. In the bibliometric analysis section, the article presents findings that shed light on trends and key contributors in the existing literature. The content analysis results and discussions section interprets these findings. The research agenda section outlines potential areas for future exploration in the field [24]. Finally, the conclusion section summarizes the key insights of the study and its implications for academic and practitioner communities.
2. THEORETICAL BACKGROUND
Productivity is typically evaluated as a rate between the production (output) of a product or service and the labor or equipment used for production (input), and it is often represented by Eq. (1),
 |
(1) |
Productivity terms are reversed between numerator and denominator when discussing equipment (output/input) and labor productivity (input/output) [25]. Without standardization in its evaluation, it depends on methods chosen by companies and managers [26-28], plus differences between projects [29]. Productivity is a primary factor for implementing BIM [1, 4, 30]. According to Jones et al. [31] and Ahankoob et al. [32], this motivates governments to promote BIM in the industry, as productivity improvements impact economic results and growth in gross domestic product [26]. Certain aspects of civil construction have a greater managerial interest [33]. Park [28] proposed analyzing productivity by listing the following factors: schedule, change orders, materials, climate, and labor productivity management. Productivity is evaluated throughout the project lifecycle, emphasizing construction phases due to labor intensification, expenses, and interferences [27]. Several authors view BIM as a digitization initiative [34, 35] facilitated by technologies like cloud computing, parametric modeling, and visualization [10, 11], enabling benefits, such as automated productivity measurement [17, 18, 36]. Despite its importance, there is a research gap regarding productivity with BIM. Therefore, the AEC industry must internalize technological changes and new business models [1, 3, 10]. Understanding the productivity impact of BIM at each stage is crucial for accelerating adoption.
3. RESEARCH METHODOLOGY
To address the research questions, a bibliometric analysis, co-citation, and content review were carried out. Bibliometric analysis refers to applying mathematical and statistical methods to publications, as defined by the person who coined this term [37].
Co-citation, a bibliometric method [38], examines how frequently two previous publications are cited together in a subsequent one. Its strength is determined by the number of authors who cited both publications, creating a relationship between citing authors. Documents, authors, or journals selected through co-citation are considered more relevant in their field [39, 40].
Co-citation analysis is performed on cited documents, not the original sample. To obtain a broader yet clear view, cutoff points were established as follows: documents cited three or more times and sources mentioned five or more times. The calculation was performed using the bibliometrix package [41]. The Louvain algorithm was applied for clusters [42] and Kamada-Kawai for visualization.
Content analysis is a systematic process to evaluate printed and electronic documents [43]. Its main goal is to adapt sampled material into a communication model, considering authors' experiences and opinions [44]. Several techniques are applicable based on objectives and analysis type [45], which are applied based on the research objectives and the type of analysis desired. The inductive method was systematically used for this research, adapted to the research context, as shown in Fig. (1).
The definition of analysis categories and the level of abstraction are the central parts of content analysis [43, 45]. The categories and analytical units were defined based on theoretical references, contents extracted from the articles themselves, and references used by the AEC industry, as shown in Table 1 in the supplementary files. The AEC industry uses BIM dimensions up to 10D, although there is little consistency between dimension references beyond the 5D dimension. The categories were used to perform frequency analysis in the final part of the article.
| Assessment Dimension | Evaluation Criteria |
Quality Indicators & Evidence (References) |
|---|---|---|
| Authority | • Institutional Affiliation, • Author Expertise, • Professional Recognition, • Academic Credentials |
Technical reports from government BIM initiatives [9], Doctoral theses [71], Expert opinions [70] |
| Accuracy | • Methodological Rigor, • Data Validation Process, • Documentation Quality, • Peer Review Status, • Reference Standards |
Empirical evidence [74], Validated metrics [77] |
| Coverage | • Scope Definition, • Population Specification, • Contextual Boundaries, • Methodological Framework |
Project lifecycle stages [78], Industry sectors [80] |
| Objectivity | • Balanced Presentation, • Stakeholder Perspectives, • Bias Recognition, • Evidence-Based Claims |
Mixed methods approaches [4], Multiple viewpoints [36] |
| Date | • Publication Period (2009-2023), • Content Currency, • Version Control, • Update Status |
Contemporary relevance [16], Temporal context [30] |
| Significance | • Research Contribution, • Practice Relevance, • Industry Impact, • Knowledge Gap Address, • Innovation Value |
Implementation insights [82]. Productivity metrics [84] |
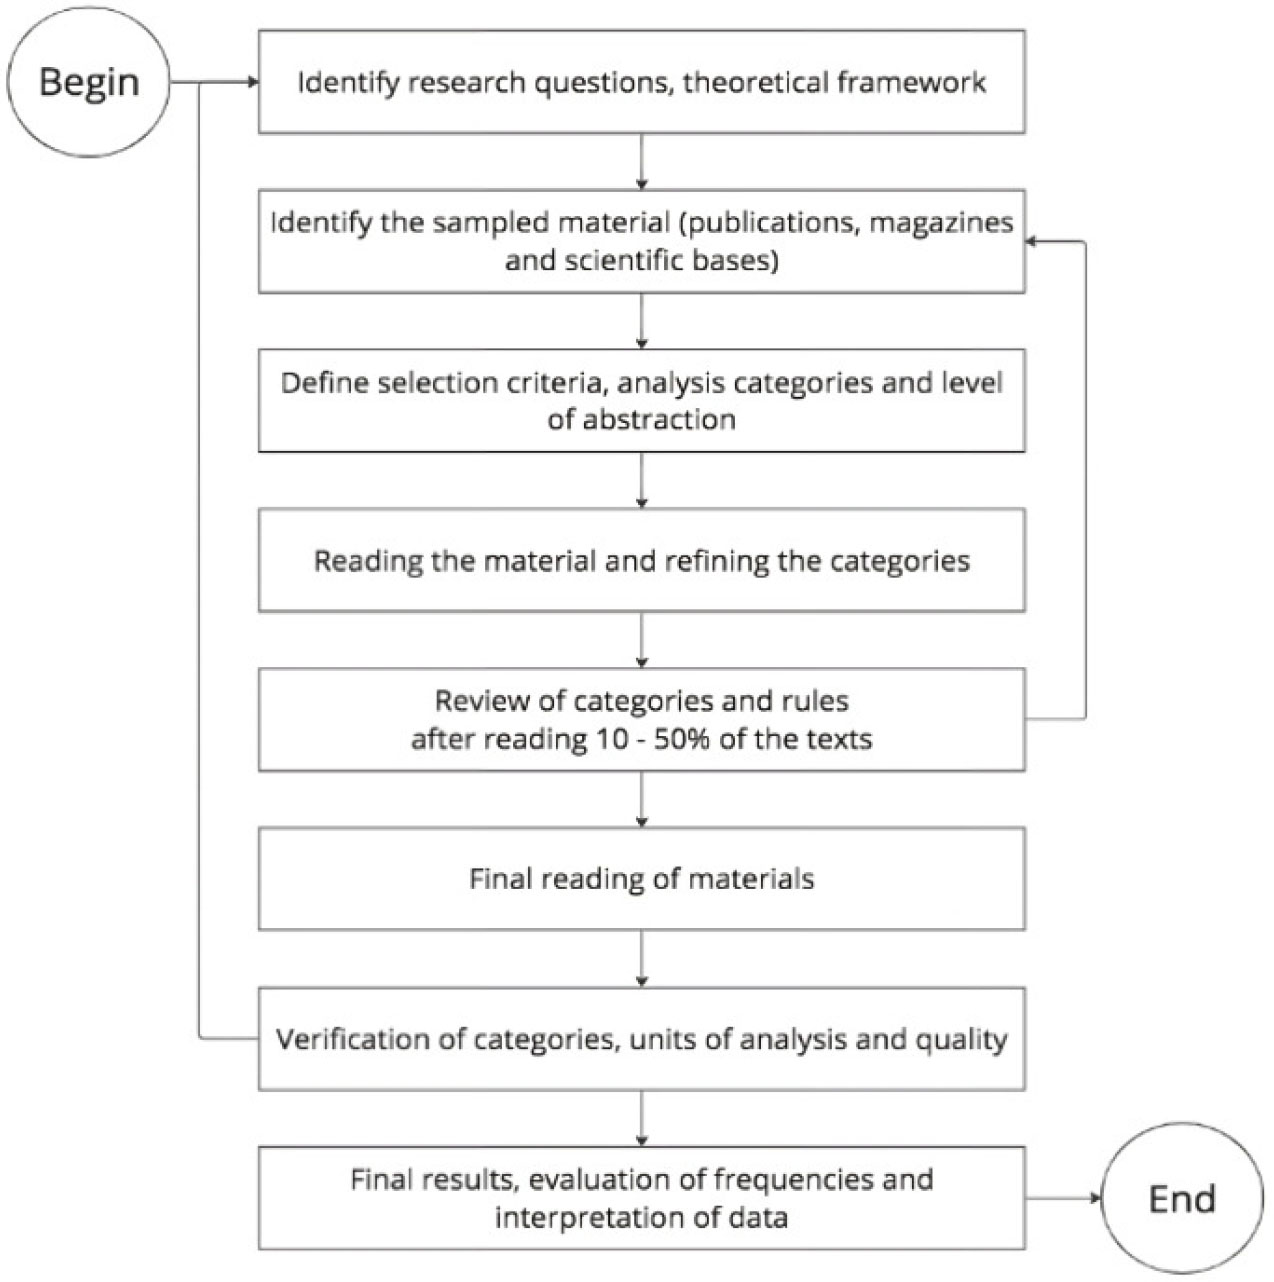
Inductive content analysis process adopted in this research [45].
The articles were read, and data and information were extracted from the documents through the interpretation of texts, graphics, and existing images. The categories served as references for information searching. The “productivity indicator” variable was interpreted and grouped according to the data collected by the authors. The extraction, interpretation, and data and information entry processes were carried out manually without using any automated tool.
To perform a quality assurance of the categories, the results of the document coding were presented in two workshop sessions, each lasting an hour, for professionals and researchers in the AEC (Architecture, Engineering, and Construction) industry. The industry professionals had experience contracting services and projects in public agencies in Rio de Janeiro. Participant 01 had over 15 years as a civil construction project development and bidding manager, while Participant 02 had 10 years in the same field. Two seasoned civil construction and BIM methodology researchers participated in the presentation, one with over 20 years of academic experience and the other with 10 years, both holding doctoral degrees.
The participants confirmed that the codes used were appropriate and represented the main analysis categories for this type of study. Following the group's confirmation, the interpretation and analysis of the obtained results continued.
3.1. Identification of Publications
To identify relevant publications in the field of productivity using the BIM methodology, a research strategy was adopted through indexed scientific article databases, national thesis and dissertation banks, and national journals covering engineering, architecture, and construction. Thomé et al. [46] suggest that at least two scientific article databases should be used in the search. Scopus and WoS were the chosen databases for the article search, as they encompass most works published in operation management [47]. Additional complementary records were retrieved from gray literature. Fig. (2) displays the process used for identification, screening, eligibility, inclusion, and analysis of studies used in this research.
A set of keywords was devised to capture all the relevant publications using the Scopus and Web of Science (WoS) databases with the search query: (productivity OR efficiency OR effort OR ROI OR cost) AND (BIM OR “building information modelling”) AND (metrics OR indicator OR kpi OR index OR “cost coefficient” OR measure OR estimating) AND (labor OR employer OR employment OR “man hour”). In Scopus, we searched the title, abstract, and keywords, yielding 99 articles, of which two were in non-English languages, 1 was published before 2000, and none were under review. The search was done on January 23, 2023. For WoS, where we used all available fields for our search, we also found 99 articles, one in a non-English language, none from before 2000, and 4 under review. This search was conducted on January 18, 2023.
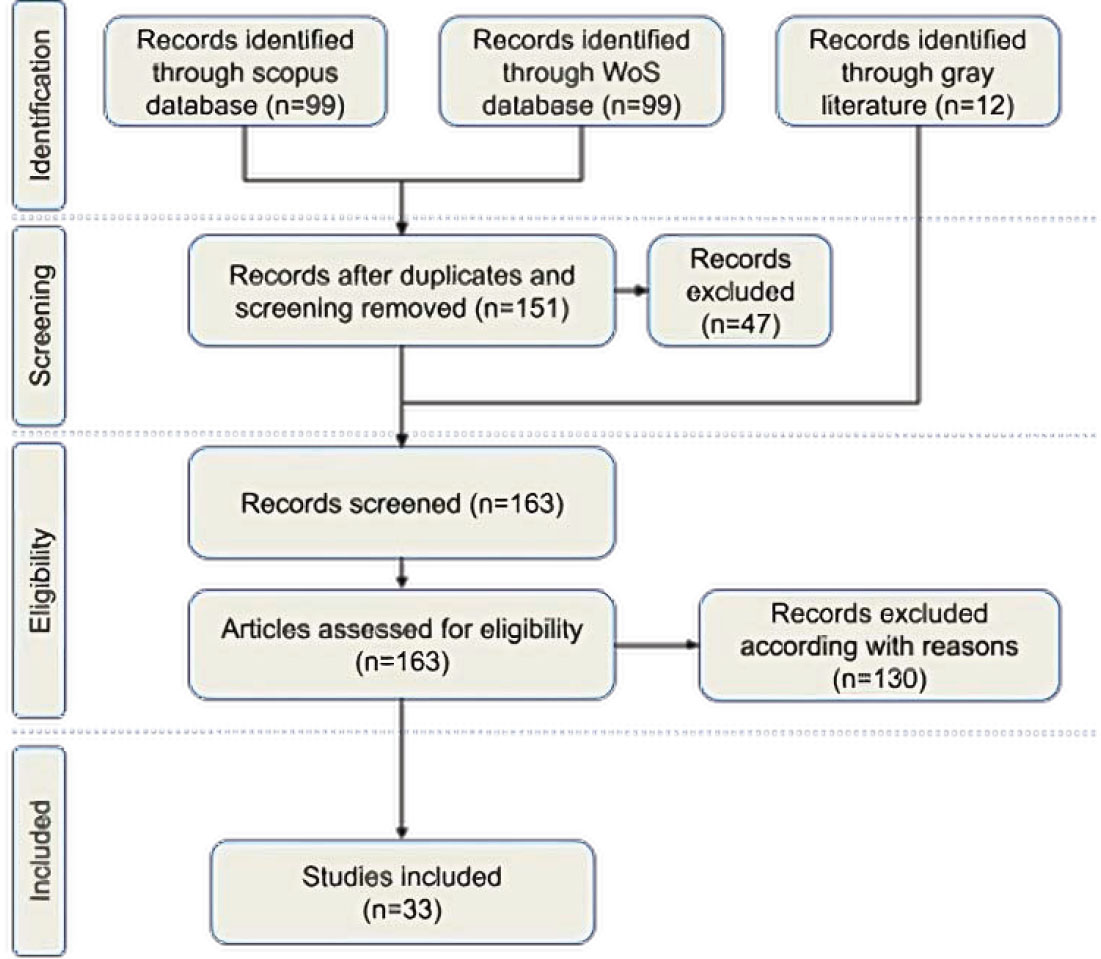
PRISMA flow diagram of the scoping review protocol.
The Scopus and WoS databases were merged using the R programming language, leading to the exclusion of 39 duplicate articles, resulting in a final set of 151. To ensure methodological rigor in evaluating gray literature, we applied the AACODS checklist (Authority, Accuracy, Coverage, Objectivity, Date, Significance) [48]. Table 1 details the systematic assessment of the 12 documents selected through a targeted search in Google Scholar, which were subsequently screened for eligibility.
The evaluation framework functioned as a systematic filter, ensuring the inclusion of only high-quality gray literature sources that met rigorous criteria. This approach aligns with Thomé et al. [46] on comprehensive source selection in systematic reviews. Each document was assessed across all dimensions, with particular emphasis on authority and accuracy to uphold research quality. The selected gray literature offered valuable insights into BIM implementation and productivity measurement, complementing gaps in indexed academic sources.
After screening, the abstracts of the documents were read for the eligibility and inclusion process, considering the established exclusion and inclusion criteria detailed in the next section. As a result of this process, 33 documents were used for content analysis.
3.2. Selection Criteria for Publications
During the content analysis process, a clear demarcation between inclusion and exclusion criteria was established to determine the relevance of publications for further analysis. These criteria provided a robust framework for selecting articles, ensuring alignment with the study's objectives.
Regarding the exclusion criteria, articles were disregarded if they utilized the BIM acronym in contexts divergent from “Building Information Modelling”, focused predominantly on the success criteria for BIM implementation, or primarily used BIM model data for purposes, such as model validation, quantitative analyses, or construction cost evaluations.
On the other hand, the inclusion criteria were crafted to encompass articles probing into the performance indicators of the BIM methodology irrespective of the discipline or project lifecycle stage. This approach also comprised publications proposing prospective BIM-related research agendas, assessing the advantages and potential drawbacks of BIM adoption with indicators as their primary evaluative tool, and studies emphasizing the competencies professionals should cultivate to implement the BIM methodology adeptly.
Such deliberate criteria selection assured a rigorous foundation for the subsequent phases of our research and comprehensive analysis.
4. RESULTS
4.1. Descriptive Statistics
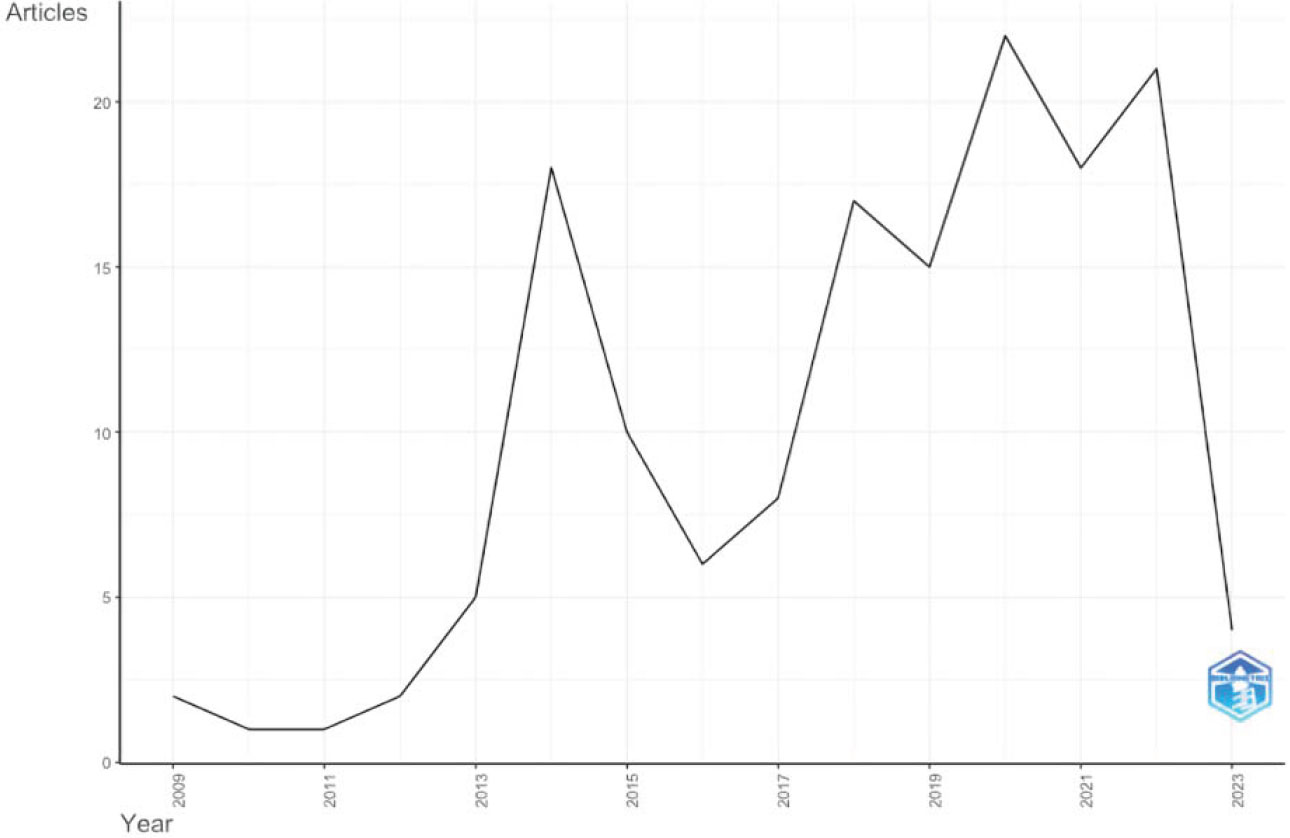
The number of publications on BIM and productivity for AEC has remained stable over the last decade, as shown in Fig. (3). It is worth noting that all 151 identified documents were published after 2009. Authors can infer two things: i) although BIM has existed since the 2000s, the study of BIM with productivity and performance is a topic that emerged in the literature from 2009 onwards; and ii) more recently, interest in the topic has increased considerably, averaging 15 annual publications between 2014 and 2022, peaking in 2020 (22 records).
Publications related to productivity using BIM are predominantly concentrated in two countries: China and the United States. Until 2022, these countries accounted for 73% of the publications, dominating the literature on this topic. Fig. (4) displays the cumulative publications from the top five countries since 2009. The significant increase in publications from these two countries in the last five years is worth noting, while other countries maintained the same publication level.
All the publications were spread across 251 research institutions. Table 2 displays the number of papers from the ten institutions that published the most research on BIM and productivity. These ten institutions account for 38% of the total publications from the Scopus and WoS databases. The recurrence of publications is quite concentrated since less than 1% of the institutions account for 38% of the publications. Institutions from Asia, Europe, and North America are noticeable, showing a global and broad academic interest in the topic.
| Affiliation | Publications |
|---|---|
| National University Singapore | 8 |
| University Lisbon | 8 |
| Beijing University technology | 6 |
| Hong Kong Polytech University | 6 |
| Hong Kong University Science and Technology | 5 |
| Huazhong University Science and Technology | 5 |
| University Alberta | 5 |
| University Waterloo | 5 |
| University Wyoming | 5 |
| Ecole Technol Super | 4 |
The central theme of BIM predominantly falls within the STEM disciplines (Science, Technology, Engineering, and Mathematics) as opposed to the SSH disciplines (Social Science and Humanities). Table 3 summarizes the classification of publications by their focus area using the above categorization.
| Focus Area | Publication Count |
|---|---|
| Engineering | 58 |
| Technology | 50 |
| Sciences | 25 |
| Humanities | 10 |
| Social | 6 |
| Mathematics | 2 |
| Total | 151 |
Annual scientific production.
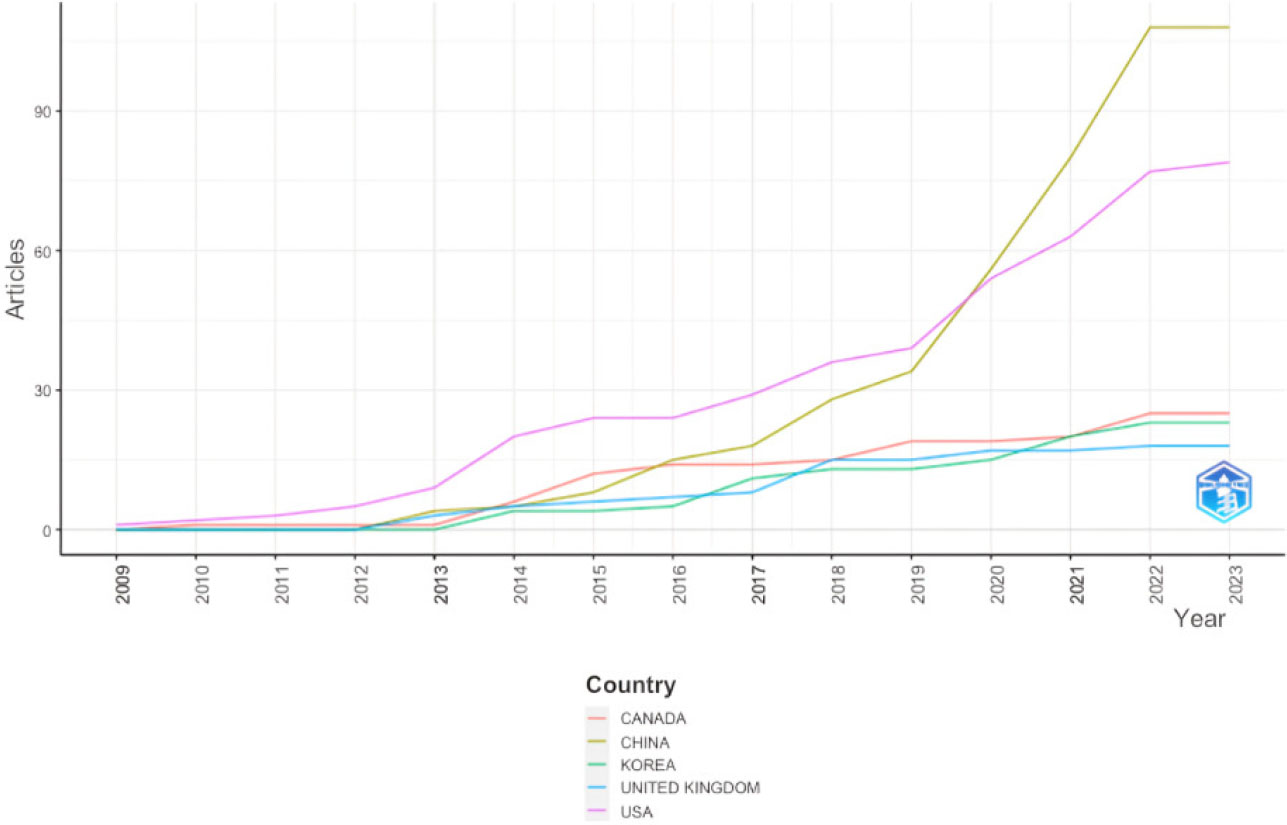
Evolution of articles from 2009 for top five countries.
Number of publications by country, individually or in collaboration.
The proportion of articles between the two leading global research divisions is quite different. Just over 10% of the articles are related to the SSH area, while 90% pertain to STEM disciplines. Furthermore, within the STEM disciplines, Engineering and Technology dominate. This finding aligns with the facilitating factors for the existence of BIM, which are technology use and the digitization of an engineering domain [10].
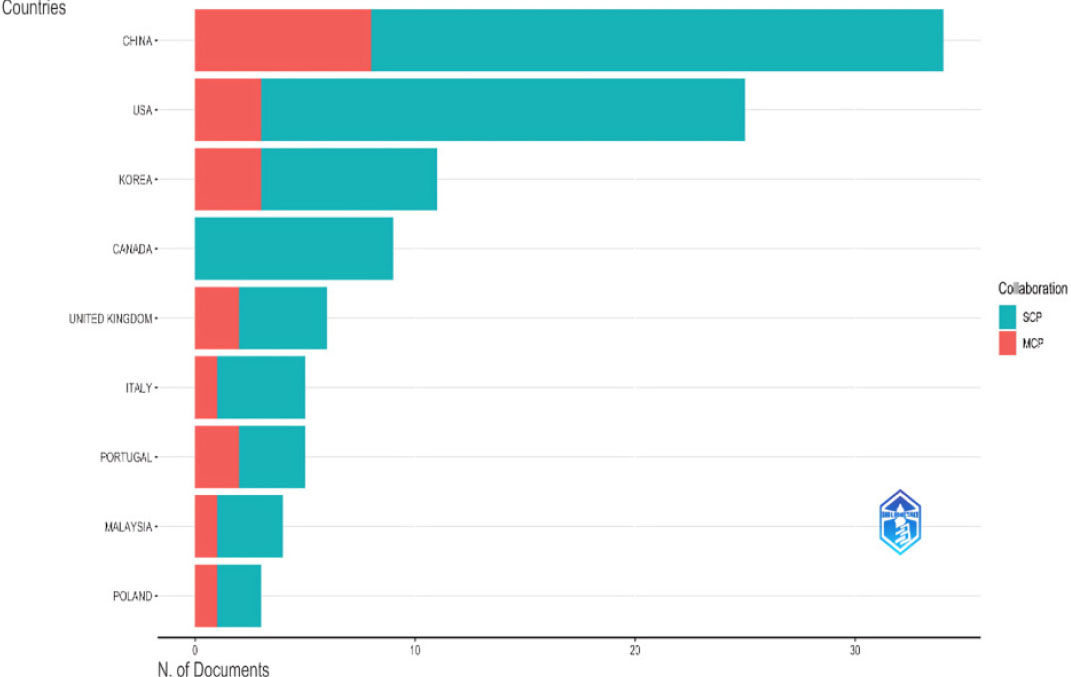
Research related to BIM and productivity tends to be predominantly conducted by researchers from the same country, also called Single Country Publishing (SCP), as shown in Fig. (5). China has the most multiple country publishing, indicating that its researchers collaborate globally. An initial analysis might suggest that research in this field tends to be less internationalized. However, this cannot be definitively stated since the internationalization process can also occur through knowledge exchange, conference participation, seminars, and visits by international researchers [49].
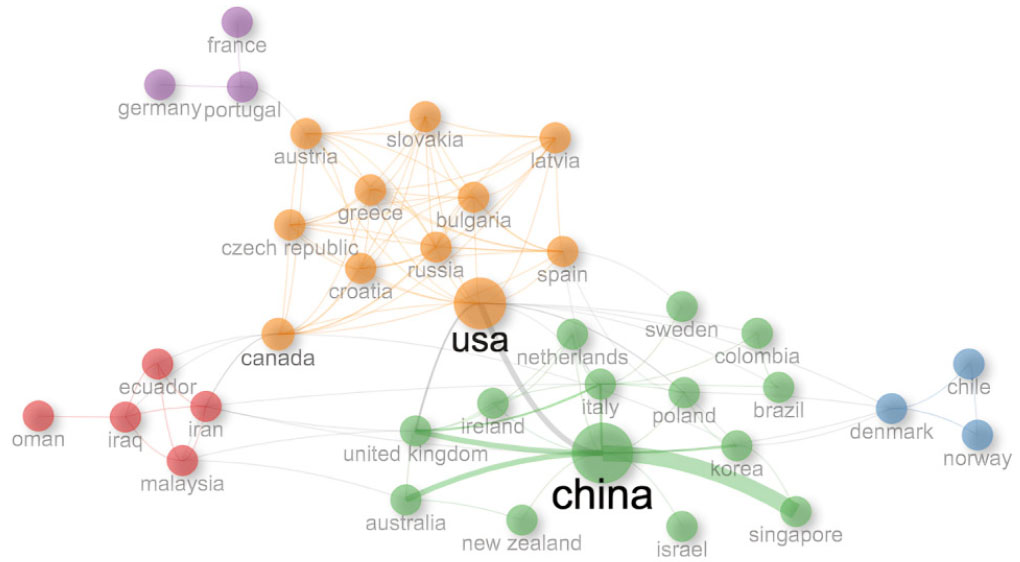
For analyzing collaboration between countries, network analysis was utilized. This analysis identifies the countries of origin of the researchers from the publications' metadata. When there is more than one author on a paper, the relationship between countries is explicitly established. Fig. (6) displays the international collaboration network among the 50 countries with the highest scientific production with at least one connection. The predominant influence of China and the United States, leading the two main clusters, is evident. These countries are orbited by nations from Europe, Oceania, Latin America, and Eastern Europe, which have a more diffused collaboration network. Three other smaller, less dominant clusters are formed, likely stemming from specific collaborations or themes. The circle diameters are proportional to publication numbers, line thickness represents the number of existing collaborations, and colors represent clusters formed by proximity. Links are shown starting from a single connection between countries.
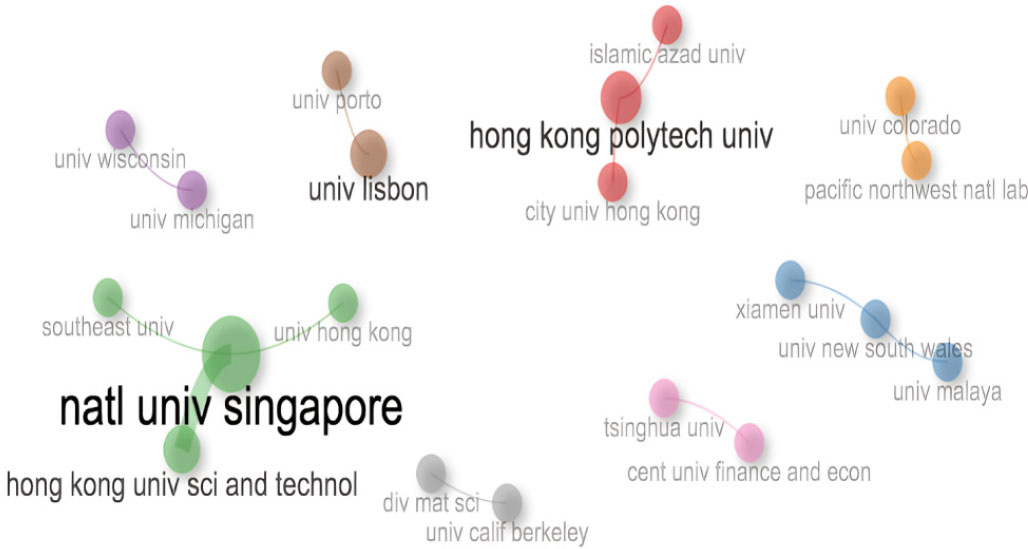
Fig. (7) displays the collaboration network among various research institutions. Collaboration mainly occurs between institutions within the same country, with a few instances involving institutions from different countries. Eight institutional collaboration clusters were formed, with the largest collaboration network consisting of four institutions. Five collaboration networks consisted of only two institutions; in these cases, the institutions were from the same country of origin.
International collaboration network for the top 50 countries in the field.
Collaboration network among institutions.
Collaboration network among the 26 researchers with the highest scientific production.
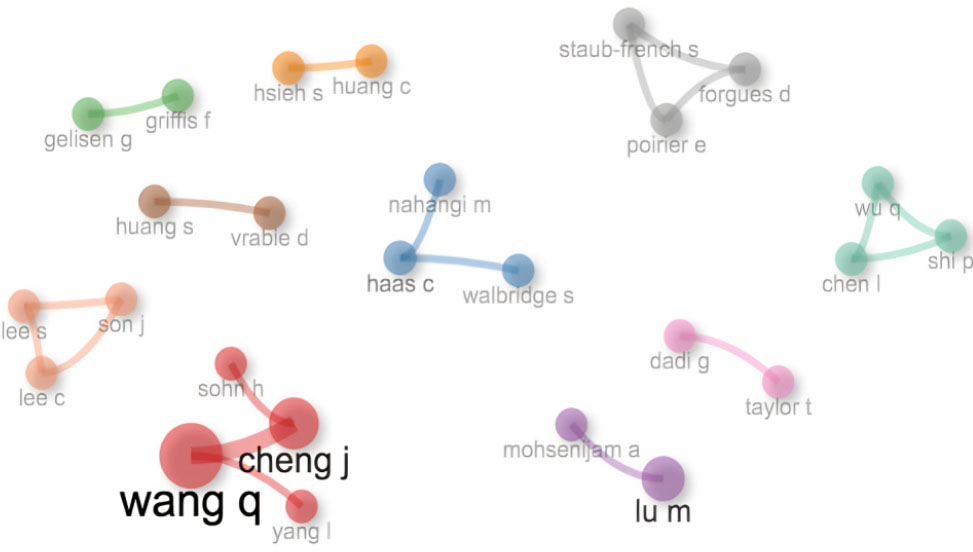
Following the same pattern of institutional collaboration, Fig. (8) displays the collaboration among authors. In total, ten clusters were formed, with a notable cluster led by Wang Q, which is the only one consisting of 4 researchers. The remaining clusters have either three or two authors in the same group. The collaboration between authors suggests that these clusters generally address the same topic since they share the same references among them. The colors represent the clusters that were formed by association, the size of the circles indicates the number of publications, and the line thickness represents the number of existing collaborations.
The analysis of collaboration patterns, be it at the level of countries, institutions, or individual authors, highlights a hierarchical structure in scientific production and collaboration in the given field. Countries, such as China and the United States emerged as primary hubs of research activity, leading large clusters of international collaboration. Similarly, at the institutional level, collaboration primarily stays within national boundaries, emphasizing the significance of domestic research alliances. The author-based collaboration further reaffirms this observation, where most clusters are formed by authors focusing on similar topics and sharing references.
4.2. Citation Analysis
The most cited documents are presented in Table 4 in the supplementary files. A review of this list unveils the foundational knowledge on the topic of productivity for the BIM methodology and provides insights into which productivity topics are tackled using BIM. This is further explored in the co-citation analysis. The most cited document is Li et al. [50], with 222 citations. The top of the list is dominated by articles about the impact of BIM methodology implementation in civil construction, the integration of sustainability practices into the BIM methodology, and the application of digital technologies integrated with the BIM model's parametric data. It can be observed that publications from 2019 onward focus on the adoption of new technologies to parametric models generated with the BIM methodology [51-53].
Applying Bradford's law of dispersion to the document base of this analysis yielded three groups [54], with Group 1 being the primary source group. Table 5 in the supplementary files displays the outcome of this law's application, offering a practical look at its behavior and its significance in document analysis. It can be seen that only 14 out of 108 total sources account for 1/3 of all documents published on the subject of productivity using the BIM methodology. The remaining groups account for this dispersion of documents across the following 100 sources. This behavior, known as the “long tail, “ is common in this type of bibliometric analysis when examining the publication distribution frequency by sources [55].
In accordance with the application of Bradford's law, Table 6 in supplementary files lists the 14 primary sources of published documents, all of which are included in Group 1. Notably, the most cited journal is “Journal Automation in Construction” with 15 citations, three times that of the second on the list, “Buildings”. The top of the list features a journal with an impact factor of 10.517 and a citation score of 15, specializing in the application of computational methods and technology to civil construction throughout any stage of the lifecycle. However, the majority on the list are journals related to civil construction and architecture, suggesting that productivity using BIM is of interest to this industry sector and not just the new technology domain. There are also conference and symposium sources, highlighting the nature of collaboration in this field as previously explored. In the sixth position, there is a journal called “Sustainability”, which adopts an interdisciplinary scope, covering a wide range of sustainability aspects for various industries.
| Total Citations | Document |
|---|---|
| 222 | LI H, 2015, SAF SCI |
| 90 | SUERMANN PC, 2009, ELECTRON J INF TECHNOL CONSTR |
| 89 | OLAWUMI TO, 2018, SUST CITIES SOC |
| 82 | BOSCHE F, 2014, AUTOM CONSTR |
| 67 | ZHANG W, 2018, J CLEAN PROD |
| 59 | POIRIER EA, 2015, AUTOM CONSTR |
| 58 | FU P, 2021, FRONT OPTOELECTRON |
| 47 | NAHANGI M, 2014, ADV ENG INFORM |
| 44 | HANNA A, 2013, J CONSTR ENG MANAGE |
| 43 | YANG L, 2020, AUTOM CONSTR |
| 41 | BOKTOR J, 2014, J MANAGE ENG |
| 40 | JIN R, 2018, ENG CONSTR ARCHIT MANAG |
| 40 | MCGUIRK CM, 2018, J AM CHEM SOC |
| 39 | WANG Q, 2018, J COMPUT CIVIL ENG |
| 39 | ZHANG G, 2015, COMPUT-AIDED CIVIL INFRASTRUCT ENG |
| 37 | QIN X, 2020, J CIV ENG MANAG |
| 36 | MARZOUK M, 2018, SAF SCI |
| 36 | BAGINSKI M, 2020, ADV MATER |
| 34 | RATAJCZAK J, 2019, BUILDINGS-BASEL |
| 34 | ROCHA G, 2020, HERITAGE |
| 33 | SIMONIN K, 2013, APOPTOSIS |
| 32 | KWIATEK C, 2019, AUTOM CONSTR |
| 31 | MA Z, 2014, PROCEDIA ENG |
| 29 | LEE J, 2017, AUTOM CONSTR |
| 29 | GUO H, 2018, J CONSTR ENG MANAGE |
4.3. Co-citation Analysis
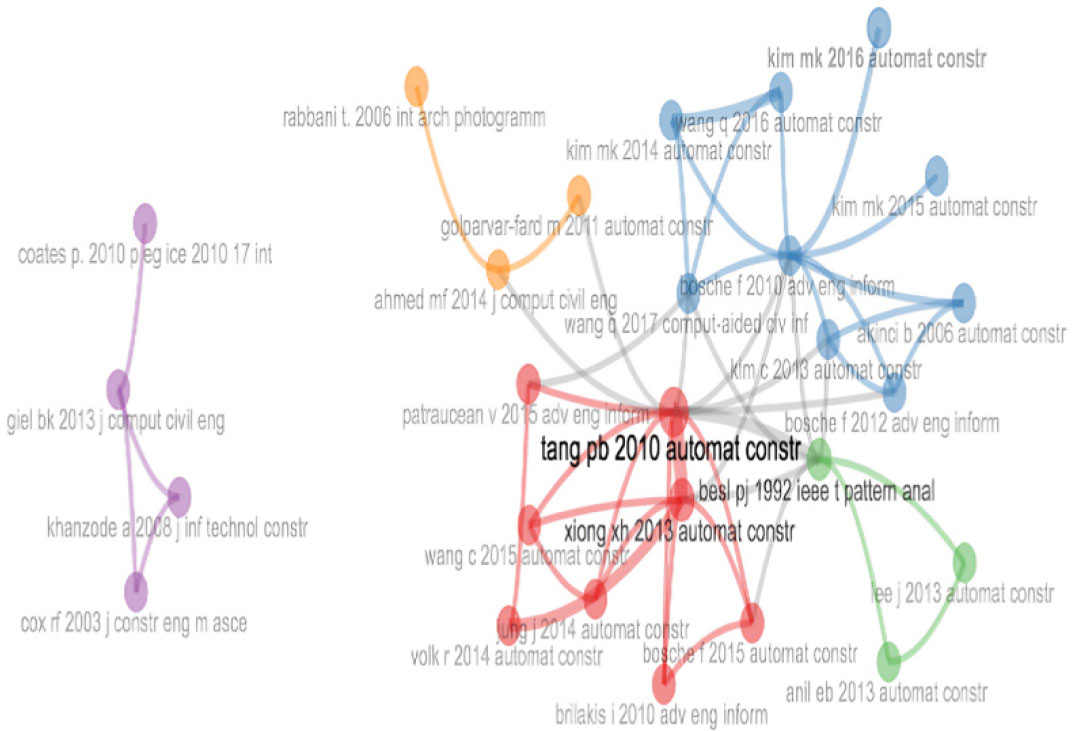
Four intellectual structure groups represent the knowledge base of the literature discussing productivity using the BIM methodology. Fig. (9) displays the formed groups and their relationships. These groups were labeled as: red group: technologies for automating the as-built process; blue group: scanner technologies for measuring construction progress; green group: quality assessment of 3D geometric models; orange group: low-cost technologies and methods for the as-built process; and purple group: return on investment from BIM adoption.
| Group | Document Count | Source Count |
|---|---|---|
| Group 1 | 51 | 14 |
| Group 2 | 51 | 45 |
| Group 3 | 49 | 49 |
| Total | 151 | 108 |
| Published Documents | Sources |
|---|---|
| 15 | Automation in Construction |
| 5 | Buildings |
| 5 | Journal of Construction Engineering and Management |
| 3 | Canadian Journal of Civil Engineering |
| 3 | IOP Conference Series: Earth and Environmental Science |
| 3 | Journal of Asian Architecture and Building Engineering |
| 3 | Sustainability |
| 2 | 31st International Symposium on Automation and Robotics in Construction and Mining, ISARC 2014 - Proceedings |
| 2 | Advanced Materials Research |
| 2 | Applied Sciences |
| 2 | Communications in Computer and Information Science |
| 2 | Computer-aided Civil and Infrastructure Engineering |
| 2 | Construction Research Congress 2022: Computer Applications, Automation, and Data Analytics - selected papers from construction research congress 2022 |
| 2 | Energy and Buildings |
There are four interconnected groups, with only one isolated. The connection among the four groups occurs due to the central use of technology in the BIM methodology, which is one of the significant enablers for its adoption.
The proximity of these groups concerning technology indicates that debates on productivity with BIM applications are directed towards i) improving the as-built process, ii) automating the assessment of construction progress, and iii) analyzing the quality of geometric models. The purple group is isolated and discusses the investment in BIM adoption and general construction performance indicators.
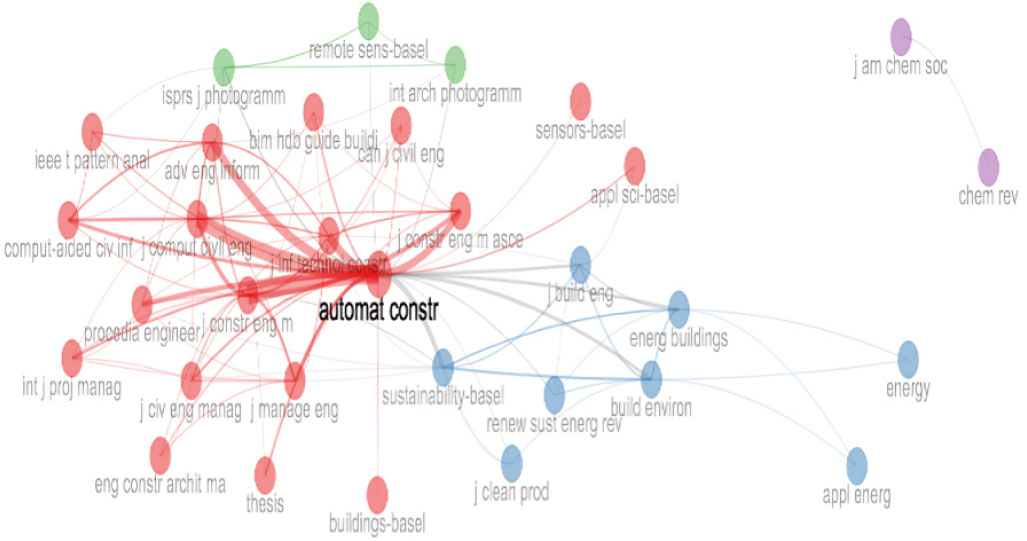
Fig. (10) displays the co-citation network of cited sources. The algorithm originally identified five clusters for the document co-citation analysis of the cited source ; however, one consisted only of conference papers and was treated as an outlier; thus, it was excluded. The four remaining groups were labeled: red group: Journals on technology and computing applied to civil engineering; blue group: Journals on sustainability and energy; green group: Journals on sensing and chemistry; and purple group: Journals on chemistry and materials.
Co-citation network of works for the groups.
Co-citation network of cited sources.
The red and blue groups have a strong connection. The red group focuses on applying technologies to the AEC industry, primarily covering building construction topics. In contrast, the blue group deals with themes spanning various industries, such as sustainability, energy, and clean production. The green and purple groups are almost isolated and revolve around the two main groups with minimal or no thematic connection.
In conclusion, high citations for the “Automation in Construction” source suggest that technological issues to improve construction processes dominate productivity discussions with BIM adoption. Yet, citations from other journals reveal the interest of a scientific community in productivity in broader fields (e.g., building performance, energy efficiency, or BIM methodology ROI analysis).
Out of the five groups from the document co-citation analysis, only one addresses productivity research for BIM adoption. This implies that most research studies focus on using and applying technologies to enhance civil construction productivity integrated with BIM. Interestingly, the latter cannot occur without the former. In other words, one cannot use technology, considering there is the BIM methodology (geometric and parametric models), without thoroughly discussing productivity and improvement factors stemming from its adoption. This topic will be addressed in more depth in content analyses.
The analysis can serve as guidance for defining future research agendas since the method identified the most impactful publications used by the technology, civil engineering, and science community members who expressed their opinions by citing these documents.
4.3.1. Validation of Bibliometric Results
The identified bibliometric patterns find validation in both the internal structure of the analysis and previous studies on BIM evolution. The observed geographic concentration in China and the United States (73% of publications) (Figs. 4, 5) reflects the findings of Lu et al. [20], who documented a similar trend in their BIM implementation analysis, attributing it to proactive government policies and technological maturity. This geographic dominance is further validated through the international collaboration network analysis (Fig. 6), revealing clusters consistent with those reported by Jones et al. [31] in their study on global BIM adoption.
The temporal evolution of BIM productivity research (Fig. 3) shows a progression that aligns with the maturity framework proposed by Succar [7], showing a transition from basic implementation studies to more sophisticated research in automation and performance analysis. This progression is additionally validated by Siebelink et al. [30], who identified similar patterns in the evolution of organizational BIM capabilities reflected in the co-citation clusters (Fig. 9).
The concentration of publications in specific sources, validated by Bradford's analysis (Table 5), where 14 main sources represent one-third of publications (Table 6), aligns with the findings of Thomé et al. [46] on typical literature distribution in operations management. This distribution reflects the field's specialization and knowledge consolidation in high-impact journals, a pattern also observed by Saieg et al. [12] in their systematic review of BIM.
5. DISCUSSION
Scoping reviews are designed to swiftly outline the primary ideas central to a research domain, highlighting major sources and varieties of evidence at hand. They are particularly valuable as independent projects, especially in intricate areas or those not yet extensively reviewed [56]. This work used content analysis to summarize all details related to the evaluated documents. The nomothetic approach was used, which seeks to generalize the results found from the evaluated documents in an aggregated manner. Thus, the identification of themes common to the evaluated documents was sought, particularly regarding the approach to productivity topics using the BIM methodology.
Table 7 below summarizes the characteristics of the examined studies by evaluation themes. It is evident that there is a dominance of “case study” and “survey” research types, which account for just over 70% of the reviewed documents. Case studies often propose applying the BIM methodology and comparing the results of their models with those generated in the traditional way. They typically report comparative results between one methodology and another, aiming to demonstrate the effectiveness of the BIM methodology compared to conventional methods. “Survey” type research evaluates the success factors of implementing the BIM methodology and the assessment of BIM maturity in architectural offices or public administration agencies.
It is observed that almost half of the documents do not identify the BIM dimension in which their models were worked. In some “survey” type research, it is impossible to establish the BIM dimension, as several companies or projects were evaluated. Nevertheless, it was possible to observe that the level of BIM utilization is still at an early stage and limited to activities currently performed by architectural offices, such as geometric and parametric design or modeling (3D), planning and scheduling analysis (4D), and estimation of quantities and costs (5D). Only two BIM applications in the 5D dimension were observed in the studies. Considering the life cycle stages of the projects, there is a broad application of the productivity theme using the BIM methodology for the preliminary design stages or the application in the pre-design and construction stages. The indicators used are related to the quality of projects and models, cost comparisons between traditional models and BIM models, and less about the actual productivity of the modeling work teams.
Such findings emphasize the scarcity of studies discussing the productivity of the project modelling teams in the pre-project phase. The still-emerging state of the BIM methodology is demonstrated by the nature of the studies, which aim to justify the benefits of the BIM methodology or a way to obtain a return on their investments and reviews and surveys exploring critical success factors.
| Id | Article | Type of Research | Type of Building | BIM Dimension | Project Lifecycle |
|---|---|---|---|---|---|
| 1 | [57] | Case study | Sports centre | 3D | Pre-project and construction |
| 2 | [17] | Action research | Multi story | 3D | Construction |
| 3 | [19] | Action research | Industrial | - | Pre-project and construction |
| 4 | [21] | Survey | Several | - | - |
| 5 | [58] | Modelling | - | - | Pre-project |
| 6 | [59] | Case study | Multi-story | - | Construction |
| 7 | [60] | Case study | Infrastructure | 5D | Pre-project and construction |
| 8 | [61] | Survey | - | - | Pre-project and construction |
| 9 | [18] | Modelling | Commercial | 4D | Pre-project |
| 10 | [19] | Action research | Commercial | 3D | Pre-project and construction |
| 11 | [62] | Survey | Residential | 3D | Pre-project |
| 12 | [57] | Survey | - | - | - |
| 13 | [4] | Mixed methods | - | - | - |
| 14 | [36] | Modelling | Hotel | 3D | Pre-project and construction |
| 15 | [63] | Modelling | - | - | Pre-project |
| 16 | [64] | Survey | - | - | - |
| 17 | [65] | Modelling | Commercial | 4D | Pre-project |
| 18 | [66] | Survey | - | - | - |
| 19 | [67] | Survey | - | - | Pre-project and construction |
| 20 | [68] | Case study | Residential | - | Pre-project |
| 21 | [69] | Survey | - | - | - |
| 22 | [70] | Survey | Highways | - | - |
| 23 | [71] | Case study | Health unit | 4D | Construction |
| 24 | [72] | Case study | sMulti-story | 5D | Pre-project |
| 25 | [73] | Case study | One floor commercial | 3D | Pre-project and construction |
| 26 | [74] | Case study | Retrofit | 3D | Pre-project |
| 27 | [75] | Case study | Passenger terminal | 4D | Pre-project |
| 28 | [76] | Survey | - | - | - |
| 29 | [77] | Constructive research | Multi-story | 3D | Pre-project |
| 30 | [78] | Case study | Multi-story | 3D | Pre-project |
| 31 | [79] | Survey | - | - | - |
| 32 | [80] | Case study | One floor commercial | 5D | Pre-project |
| 33 | [81] | Case study | Multi-story | 5D | Pre-project |
In the next section, a more detailed interpretation of the thematic groups identified through variables such as the type of projects, stages of the life cycle, and their respective indicators and indexes was carried out.
5.1. Interpretation of Thematic Groups
5.1.1. Types of Projects
The BIM methodology is a new approach to the process of designing, constructing, and managing assets and can be applied to any project [2]. Despite the widespread application of the BIM methodology to any project type, there seems to be a consensus among researchers that more complex projects benefit more from the use of BIM as a form of risk management [1, 10, 11], and also as a way to improve return on investment [20, 82]. Thus, the documents were grouped according to three types of projects with similar characteristics and complexity: residential buildings, commercial buildings, and industrial or specific buildings.
Eight documents, encompassing one—or multi-story constructions, represented residential building projects. These documents were mostly case studies for the application of the BIM methodology and comparison with traditional project and construction methods. In this regard, the indicators used sought to represent the relative percentage difference between the two evaluated methods.
A characteristic of the application studies for this type of project is the selection of a specific activity for comparison. The comparison between methodologies was also limited to the initial BIM dimensions, notably 3D. In this dimension, it is possible to perform the geometric comparison of objects and elements and establish project compatibility, one of the main factors causing issues in construction [2]. Only two studies used the 5D dimension for project modeling, thereby obtaining project indicators with planning and cost information. Additionally, these studies show a comparison between the two modeling methodologies, traditional and BIM.
Commercial projects, comprising one or multi-story constructions, represented seven documents, three of which were case studies for the application of the BIM methodology and comparison with traditional project and construction methods. Comparative indicators were used, aiming to represent the relative percentage difference between the two evaluated methods. Indicators were applied to assess the difference between the indicators for evaluating the number of interferences and the project quantity sheet [73, 80]. Three other studies proposed techniques for automating productivity analyses [18, 65]. It was also noted that four documents were used in the pre-project stages up to the construction phase. This also reflects the types of indicators adopted by the research, where some are geared towards evaluating the construction phase, such as (estimated/realized), waste management, and construction management. Other indicators were adopted to assess team productivity for different activities (estimated/realized), budget performance (estimated/realized), and model quality (number of reworks).
The industrial or specific projects include industrial constructions or special constructions (sports centers, art works, and highways). This group had 6 documents, and 5 were case studies for the application of the BIM methodology. However, in contrast to what was observed in the previous two groups, these studies did not aim to compare the BIM methodology to traditional methods but aimed to obtain and report the benefits of BIM adoption in projects. This may indicate that there is already knowledge of the benefits of adopting the BIM methodology in more complex applications [19, 31, 36].
Furthermore, 12 studies did not fit into these defined project groups, and 75% were of the “survey” type. These types of studies sought to deepen knowledge on a specific topic – evaluating the industry concerning BIM use, identifying success factors or the impact of the BIM methodology, and the state of BIM practice in public organizations. Therefore, they tended not to be so specific as to be categorized into just one typology. Some of these studies used specific indicators, based on the emphasis of their analyses and the research questions they wanted to answer. The indicators used by these studies aimed to assess model quality aspects like rework, project changes, and information requests [4, 83]. However, other studies sought to evaluate indicators related to construction works and team productivity in construction activities or monitor managerial aspects of the works [57, 66, 67].
From this thematic analysis by project type, it can be observed that as project complexity increases, academia shows more interest in analyzing and using productivity indicators more oriented towards the performance of mechanical and electrical assembly teams. One indicator that appears in all types of projects is the identification of project interference, seen by various authors and surveys as one of the main motivators for applying the BIM methodology for model development [1, 2, 19, 31, 84, 85].
The establishment of standardized productivity indicators for BIM implementation requires a multi-faceted strategic approach. According to a previous study [23], successful standardization must integrate technological, organizational, and environmental dimensions while considering industry-specific challenges. This aligns with recent findings [85], which demonstrated that standardized indicators should be mapped across different project lifecycle stages and organizational levels to ensure comprehensive coverage. To operationalize these standards, a recent study [11] proposed a framework that combines both quantitative metrics (such as time, cost, and resource utilization) and qualitative indicators (including quality, safety, and stakeholder satisfaction). Furthermore, another study [10] emphasized that standardization efforts must address three key areas: technical interoperability standards, performance measurement protocols, and process workflow guidelines. To implement these standards effectively, organizations should adopt a phased approach(see Table 8), beginning with basic productivity metrics and gradually incorporating more sophisticated indicators as BIM maturity increases [30]. This strategic framework, detailed in Table 8, provides a practical roadmap for industry practitioners while ensuring sufficient flexibility to accommodate different organizational contexts and project requirements.
| Maturity Level | Focus Areas/Refs. | Key Productivity Indicators | Implementation Guidelines |
|---|---|---|---|
| Basic Level 1 |
3D Geometric Modeling [86], Basic Documentation [87] |
Model accuracy rate [%], Design review cycle time [days], Clash detection efficiency [number of conflicts/week] |
Start with fundamental modeling metrics and basic workflow measurements |
| Intermediate Level 2 | 4D Schedule Integration [88], 5D Cost Analysis [89] | Schedule compliance rate [%], Cost estimation accuracy [%], Resource utilization efficiency [planned vs. actual], Cross-discipline coordination time [hours] |
Integrate time and cost metrics with existing indicators |
| Advanced Level 3 | Multi-disciplinary Integration [90], Performance Analysis [91] | Project delivery efficiency [planned vs. actual duration], Team collaboration index [based on information exchange rates], Change order reduction rate [%], Energy performance optimization [kWh/mÂ2] |
Focus on integrated performance metrics across disciplines |
| Optimized Level 4 | Lifecycle Management [92], Predictive Analytics [93] | Operational efficiency [maintenance cost reduction], Asset performance index, Sustainability metrics [carbon footprint], ROI on BIM implementation [%] | Implement comprehensive lifecycle indicators with predictive capabilities |
| Productivity Indicator Used Followed by the Unit | Article Id. |
|---|---|
| Pre-project | - |
| EPI - Energy Performance Index (Energy Performance) | [5] |
| Total project duration [days], activity duration [days], and total labor cost [USD] | [10] |
| Project team productivity [qualitative]; modeling time [hours]; number of errors [units], and project interference [units] | [34, 32, 12] |
| Employee productivity rate [unit/person-hour]; number of work cycles [units] | [19] |
| Time taken for quantity estimation [hours] and costs [USD] | [21] |
| TCPO and SINAPI productivity indices [%] | [30] |
| Number of criteria in accordance with the standard [units] | [36] |
| Comparison of quantities across various disciplines [% deviation]; comparison of project execution costs for disciplines [USD] | [39, 37, 40] |
| Pre-project and construction | - |
| Number of detected interferences [units]; number of resolved conflicts [units]; labor cost [USD]; rework rate; equipment operation time [qualitative]; operation costs [qualitative]. | [31, 13] |
| Productivity [forecast/actual], scope performance [number of Requests for Information (RFI) and change requests], budget performance [actual/planned], schedule performance [actual/planned], project quality [amount of rework]. | [11] |
| Total construction time [days] and total project cost [USD] | [8] |
| Quality control [amount of rework], schedule control [qualitative], cost control [qualitative], safety [qualitative], cost per unit [unit/person-hour] | [9] |
| Productivity and productivity rate of the mechanical assembly team [units/person-hour] | [18, 3] |
| Conflict reduction [amount], rework cost reduction [qualitative], error reduction [qualitative], as-built cost reduction [qualitative], reduction in information requests [amount]. | [23] |
| Construction | - |
| Daily construction productivity [work completed in a day/person-hour], adherence to the plan [work done/planned work] | [7, 2] |
| Reduction of construction waste [m3]; increased productivity in facility execution [qualitative], average daily assembly [units assembled/number of workdays]. | [29] |
This progressive framework provides organizations with a structured approach to implementing BIM productivity indicators based on their maturity level. As suggested by Siebelink et al. [30], organizations should focus first on mastering basic indicators before progressing to more complex metrics. Each level builds upon the previous one, ensuring sustainable development of BIM capabilities while maintaining measurable productivity improvements. This staged approach aligns with previous findings [85] on the importance of systematic integration across project lifecycle stages, while addressing the emphasis on comprehensive standardization efforts suggested in another study [10]. The framework provides clear operational guidance while maintaining sufficient flexibility for adaptation to specific organizational needs and project requirements.
5.2. Project Life Cycle Stages
The BIM project development methodology should be adopted throughout the life cycle of an enterprise to maximize its benefits and optimize the return on investment made [30, 31]. Recent bibliometric evidence supports this view, highlighting how digital transformation through BIM needs to span all project stages to realize its full potential [16]. However, the reviewed studies did not identify any application in the subsequent phases of building construction, such as operation, maintenance, dismantling, and demolition. Out of the analyzed studies, 13 addressed the pre-project phase, 8 covered both the pre-project and construction phases, 3 focused on the construction phase, and 9 studies did not address a specific area and hence could not be classified under this variable. Table 9 presents the indicators grouped by the project life cycle stages.
Studies focusing on the pre-project phase showed a heightened interest in analyzing project interferences, quantifying construction items (materials and services), and planning and budgeting items. Thus, it is evident that such indicators reflect the project planning aspects inherent to this phase preceding the construction works.
Studies that centered their analyses on the pre-project and construction phases demonstrated an interest in analyzing the productivity of their construction teams and project quality (number of interferences). Some studies assessed rework rates and made comparisons with previous projects (without the adoption of the BIM methodology) to ascertain benefits. Therefore, a significant portion of the indicators is directed towards analyzing various project items, including costs, labor productivity, and schedules, comparing what was planned with what was executed on-site.
Some studies also focused on modeling technologies or processes for automatically verifying work progress and field team productivity.
The studies that focused on the construction phase exclusively displayed an interest in analyzing the productivity of their construction teams or the overall performance of the construction (e.g., Reduction in waste generation). The aim of these studies was to verify planning adherence to what was achieved for specific activities or cost items. These indicators aim to cater to the interests of work executors, whether contractors or construction companies.
| Pre-design Stage |
|---|
| 1. What is the productivity difference between teams in the pre-design phase using traditional methodology versus BIM methodology? 2. What is the impact of the development level on team productivity in the pre-design phase using traditional or BIM methodology? 3. How to establish common productivity indicators for project analysis and compatibility using BIM methodology? 4. How to establish common productivity indicators for building performance using the BIM methodology? (energy efficiency, lighting, security, building safety) |
| Construction Stage |
| 5. How to expand the spectrum of productivity analysis in the construction industry, adopting other indicators like safety, environment, and materials management through BIM methodology? |
| Operation Stage |
| 6. How to integrate equipment control and operations using BIM methodology? 7. How to incorporate sensors for the analysis and monitoring of building productivity? 8. How to integrate control and operations of buildings during the occupation and operation phase? |
| Entire Life Cycle |
| 9. Which productivity indicators can be adopted for BIM dimensions above 5G? 10. How to ensure the integration of project productivity indicators across all life cycle stages using the BIM methodology? |
5.3. Research Agenda
The assessed studies showcased a diversity of productivity indicators applied to the pre-design and construction stages, spanning three project typologies, from the simplest to the most complex, based on the number of disciplines and details necessary for construction. The synthesis of indicators showed better adherence according to the project life cycle stages. Considering productivity indicators, some received more attention from the research community, while others still require further research in the future.
Formulating clear and specific research questions based on the analyses and discussions presented in the previous sections is an effective strategy to identify potential directions for future research in the field of productivity using the BIM methodology. Table 10 presents a series of research questions designed to guide new studies following this theme.
Regarding the pre-design stage, studies on building performance and productivity within the context of all project stakeholders, considering operational aspects in asset design, could be considered. Knowing that the sustainability of the civil construction supply chain needs to be advanced [94], studies on building energy simulation, lighting, and waste generation will be highly relevant in the future. Few studies in the literature deal with integrating project aspects and operational productivity assessed through the BIM methodology. Furthermore, it is common among authors that the AEC industry is fragmented across project life cycle stages, and there is an ongoing debate in the literature about setting competing objectives among different project actors, depending on interest and life cycle stage [27]. In this sense, research focusing on establishing goals and productivity indicators common to all life cycle stages is essential.
5.4. Validation of Content Analysis Results
The content analysis validation is supported by multiple lines of evidence that converge with previous research. The identified distribution of project types (Table 7) finds support in the work of Cao et al. [1], who documented a similar distribution in their analysis of BIM implementation motivations. The predominance of studies in the pre-project and construction phases (Tables 7, 9) coincides with Wang and Chen's [85] findings, who identified these stages as critical for BIM-project management integration.
The identified productivity indicators (Table 9) are validated through their alignment with established frameworks. For example, the categorization by life cycle stages coincides with the model proposed by Park [28], who emphasized the importance of evaluating productivity across different project phases. The progression of indicators from basic to advanced (Table 8) finds validation in the work of Poirier et al. [19], who documented a similar evolution in BIM performance measurement.
The validity of the proposed progressive indicator framework (Table 8) is reinforced through its alignment with recent studies and identified thematic clusters (Figs. 9, 10). Dixit et al. [26] identified similar patterns in the evolution of construction productivity metrics, while Zavadskas et al. [11] validated the importance of phase-specific indicators in risk and project performance assessment. This convergence between our findings and existing literature provides robust validation of the obtained results.
CONCLUSION
The construction industry has always been driven to enhance its productivity, whether in project design, organization, or industry terms. The digitization of the construction industry offers an opportunity to accelerate productivity gains throughout its production and service chains. Various aspects of productivity have been studied with the adoption of BIM, yet its implementation remains a subject of study among academics, and the industry is still assessing its benefits. However, the development and application of the BIM methodology remain nascent and limited to the traditional model of the civil construction industry for evaluating its productivity, as reflected in most articles in this field published over the last thirteen years. This article provided a scoping review of the existing literature on productivity using the BIM methodology, aiming to offer guidance on this subject for scholars and outline clear pathways for future research.
The study identified and classified productivity indicators with BIM application into two distinct categories: by project type and by project life cycle stage, directing future research questions to cover areas that remain insufficiently explored or unexplored. Thus, many unanswered paths remain open for academia concerning productivity using the BIM methodology and its usage to propose new productivity assessment methods. While this scoping review provides valuable theoretical insights into BIM productivity metrics and implementation patterns, we acknowledge the need to validate these findings through empirical evidence from actual construction projects. Future research should adopt a mixed-methods approach that combines systematic literature analysis with comprehensive case studies of BIM-implemented projects across different scales and complexities. This integration would serve to validate theoretical frameworks, document real-world challenges, measure actual productivity impacts, and identify gaps between theoretical benefits and practical outcomes. Additionally, longitudinal studies of BIM-implemented projects could reveal how productivity gains evolve over time as organizations mature in their BIM capabilities, providing valuable insights for standardization efforts of productivity metrics in real-world applications.
Beyond intending to stimulate scientific research, this study also aims to provide members of the construction industry with an overview of discussions on productivity with BIM adoption so they can deepen their knowledge on this topic, its practices, and technologies, aiding in the BIM methodology adoption process and formulating more effective strategies for its implementation and dissemination.
AUTHORS’ CONTRIBUTIONS
The authors confirm their contribution to the paper as follows: E.T.C. and A.M.T.T.: Validation; M.C.: Data collection; F.D., C.A.D.S., and R.C.: Draft manuscript. All authors reviewed the results and approved the final version of the manuscript.
LIST OF ABBREVIATIONS
| SSH | = Social Science and Humanities |
| SCP | = Single Country Publishing |
AVAILABILITY OF DATA AND MATERIALS
The data and supportive information are available within the article.
FUNDING
This research was funded by the National Council for Scientific and Technological Development (CNPq) [Grant numbers: 307173/2022-4, 405734/2023-9, 442384/2023-8], Carlos Chagas Filho Foundation for Research Support of Rio de Janeiro State (FAPERJ) [Grant numbers: E-26/201.363/2021 (260426), E-26/204.408/2024 (297945)], and Coordination of Higher Education Personnel Improvement (CAPES) [Grant numbers: Finance Code 001]. We also thank the Tecgraf Institute of Technical-Scientific Software Development of PUC-Rio (Tecgraf/PUC-Rio).
CONFLICT OF INTEREST
Dr. Rodrigo Goyannes Gousmao Caiado is Editorial Board Member of journal The Open Construction & Building Technology Journal.
ACKNOWLEDGEMENTS
Declared none.